


Most indie bookstores can tell you their total revenue down to the dollar, but ask which channel actually earns the most per hour of staff time and you get a shrug. The register rings the same whether a book went out the door at full retail, shipped through a marketplace at a 15% haircut, or came bundled into a subscription box with three freebies. Money came in. Everyone assumes it's fine.
Revenue hides the truth. A marketplace order that looks like a $22 sale can net you less than a $14 walk-in once you strip out the referral fee, packing labor, the box, and the reality that you're eating return shipping on roughly 4% of them. Meanwhile that event you keep running because "it builds community" might be quietly the most profitable thing you do — or a slow leak you've been subsidizing for two years. Without a shared way to compare them, you're effectively managing four different businesses that all pretend to be one.
That's the case for a bookstore unified profitability model: a single workbook where every revenue stream gets held to the same cost logic, so retail, marketplace, events, and subscriptions can finally sit next to each other. Not four separate spreadsheets built on four different assumptions. One structure, applied consistently.
Why Channels Never Get Compared Fairly
The reason this breaks in almost every store comes down to accounting habit. Costs get tracked where they're easy to see, not where they actually happen.
Cost of goods is easy — you know what you paid the distributor. So most owners stop there and call the leftover "margin." But the moment a book leaves through different channels, it picks up wildly different downstream costs that never make it into the mental math:
-
A retail sale carries almost no incremental fulfillment cost, but silently absorbs rent and staffing overhead.
-
A marketplace sale carries a referral fee, closing fee, and packing labor, plus a return rate that retail never sees.
-
An event sale is tangled up with staff hours, space, and often a wholesale-ish discount to the author or publisher.
-
A subscription box carries curation time, packaging, and the uncomfortable reality that acquisition cost and churn quietly decide whether the whole thing works.
When these costs live in different places — some in COGS, some buried in "operating expenses," some nowhere at all — you can't line the channels up next to each other. Each one gets measured with a different ruler. That's the core failure. It's not that owners are bad at math; it's that the four channels were never put on the same measurement system.
Your P&L tells you the store made money last month. It does not tell you which activities made that money, and which ones were carried by the others. The unified model answers that second question.
The Four Cost Layers Every Channel Has to Pass Through
Before any worked example, you need one consistent cost stack applied to every stream. The layers don't change — only the numbers you plug in do.
Never miss a sale or stock shortage again.
Bookstorely helps you manage inventory, orders, and customer relationships seamlessly.
- Integrated inventory tracking
- Customer purchase history
- Sales reporting & analytics
No credit card required
Layer 1 — Direct product cost. What you paid for the item. Same across all channels. The only truly clean, comparable number you start with.
Layer 2 — Incremental fulfillment cost. Everything that only happens because of that specific sale: packing materials, shipping, marketplace fees, payment processing, the labor to pick and pack. Retail's incremental cost is nearly zero. A shipped marketplace order might run $6–$9. This is where channels start to diverge hard.
Layer 3 — Overhead allocation. Rent, utilities, base payroll, software, insurance — costs that exist whether or not any single sale happens. These need to be spread across channels using a defensible driver: square footage, labor hours, or revenue share. Most stores skip this entirely, which is exactly why retail looks worse than it is and subscriptions look better than they are.
Layer 4 — Inventory burn. The cost of stock aging, getting damaged, or eventually getting marked down. A book sitting on the shelf for 400 days ties up cash and eventually clears below cost. That's a real per-unit cost that needs to be spread across the sales that do happen, especially for slow-moving categories.
Every channel passes through all four layers. No exceptions, no convenient skips because a channel makes the math awkward. When you enforce that consistently, the comparisons become honest for the first time. If you've already built a per-order margin waterfall, you've essentially got Layers 1 and 2 for one channel — this model extends that same logic across the entire store.
Worked Example 1: A Single Order Across Two Channels
Take one $28.00 hardcover and run it through retail and marketplace using identical cost logic. Distributor cost is $16.20 (about 42% off list, which is typical for independent accounts).
| Cost layer | Retail (walk-in) | Marketplace (shipped) |
|---|---|---|
| Sale price | $28.00 | $25.99 (priced to compete) |
| Direct product cost | $16.20 | $16.20 |
| Incremental fulfillment | $0.60 (card processing) | $8.40 (fees + box + postage + labor) |
| Overhead allocation | $3.10 | $2.20 |
| Inventory burn (avg) | $0.40 | $0.40 |
| Net contribution | $7.70 | -$1.21 |
The retail sale nets around $7.70. The marketplace sale, priced $2 lower to stay competitive and carrying roughly $8.40 of real fulfillment cost, actually loses money on this title. Not because marketplaces are inherently bad — but because this particular book, at this price point, can't absorb the channel's cost stack.
What most owners miss: it's not the channel that's unprofitable, it's the combination of price point, margin, and channel cost. A $45 art book with the same $8.40 fulfillment burden sails through marketplace just fine. The model tells you which titles belong in which channels instead of dumping everything everywhere and hoping it averages out. Getting your marketplace pricing and stock sync right matters here too — thin margins turn negative fast when oversells and reconciliation errors start eating into an already tight number.
Worked Example 2: An Event Weekend
Events are where the unified model does its most surprising work, because event costs are almost entirely Layer 2 and Layer 3 — and stores rarely track either of them honestly.
Say you host an author signing on a Saturday. Here's the weekend, run through the same four layers:
-
Revenue 52 copies sold at $26 = $1,352, plus $180 in coincidental sales from foot traffic = $1,532 total.
-
Direct product cost 52 copies at $15.60 = $811, plus roughly $105 on the other sales = $916.
-
Incremental fulfillment signing table setup, extra card terminal, author arrangements, and about 9 staff-hours beyond normal at ~$19/hr fully loaded = roughly $260.
-
Overhead allocation the store was open anyway, so you allocate only the marginal space and utility use, plus promo spend for the event — call it $140.
-
Inventory burn you over-ordered — 70 copies in, 18 unsold and now aging on the shelf. Expected burn on those = about $95.
Net contribution: $1,532 − $916 − $260 − $140 − $95 = roughly $121.
That's a thin result for a full Saturday of work. The culprit is obvious the moment you see it laid out: the 18 unsold copies. Over-ordering quietly converted a decent event into a near break-even one. Order 55 copies instead of 70 and the same event nets closer to $200+ with far less shelf drag afterward.
This pattern shows up constantly — events feel successful because the room was full and the register was busy, but the after-cost of unsold inventory lands weeks later and never gets connected back to the event. The unified model forces that connection. For a deeper build on the ticketing and capacity side, the event P&L breakdown pairs directly with this layer logic.
Worked Example 3: A Subscription Cohort
Subscriptions are the trickiest to model because profitability isn't per-box — it's per-cohort over time. A single box can look great while the program bleeds, because churn and acquisition cost live outside any individual shipment.
-
Monthly gross per box $32 × 40 = $1,280
-
Direct product cost ~$17/box = $680
-
Incremental fulfillment packaging, insert, postage, curation labor ~$7.50/box = $300
-
Overhead allocation ~$2/box = $80
-
That leaves about $220/month contribution for the cohort — before acquisition cost and churn.
Now the parts stores forget. You spent roughly $18 per subscriber to acquire them — $720 upfront, spread across their lifetime. And this cohort loses about 8% of members per month. At that churn rate, the average subscriber sticks around 12–13 months.
Each subscriber's lifetime contribution ends up around $5.50/month × 12.5 months ≈ $69, minus the $18 acquisition cost = about $51 net over their whole life. Multiply by 40 and the cohort is worth roughly $2,040 in lifetime contribution — earned slowly, over more than a year.
Subscriptions almost never look good in month one and almost always look good by month ten — if churn is controlled. Push churn from 8% to 12% and average lifetime drops to around 8 months, which nearly halves lifetime value and can flip the whole program negative. The number that decides everything isn't the box margin, it's retention. If your boxes feel like they're leaking money, the subscription launch and fulfillment playbook digs into the fulfillment side that this model quantifies.
The Prioritization Matrix for Indie Volumes
Once every channel runs through the same four layers, you can rank them — but not on margin alone. At indie volume, staff time is scarcer than shelf space, so the matrix needs to weigh contribution per unit against labor intensity and scalability.
| Channel | Contribution/order | Labor intensity | Scales without new labor? | Priority read |
|---|---|---|---|---|
| Retail (in-store) | High | Low | Limited by foot traffic | Protect & optimize |
| Marketplace | Low–Med (title-dependent) | Med | Yes, if synced | Curate ruthlessly |
| Events | Variable | High | No | Run selectively |
| Subscription | Low/box, High lifetime | Med–High | Yes, if churn held | Grow patiently |
What this usually surfaces for small stores: retail is the quiet workhorse that overhead allocation makes look mediocre but actually carries the store. Marketplace only wins when you're disciplined about which titles go there. Events should be judged by whether they clear their inventory, not by whether they fill the room. And subscriptions are a long game worth pursuing only if you can hold onto people past month four or five.
When This Model Actually Makes Sense — And When It Doesn't
Worth building if you're running three or more channels and genuinely can't tell which one is subsidizing the others. That's the sweet spot. If you have real channel conflict — deciding whether to keep doing events, whether marketplace is worth the headache, whether to expand the box — the model pays for itself in the first decision it changes.
It's not worth the effort if you're a single-channel store doing almost all in-person retail. The overhead of maintaining the workbook exceeds the insight you get. Same if your volume is low enough that every number is noise — a channel doing four orders a month can't be measured reliably, and you'll fool yourself with averages built on tiny samples.
Who should skip it entirely: anyone who won't commit to updating the cost inputs quarterly. A profitability model running on stale fulfillment costs and last year's churn rate is worse than no model, because it gives you false confidence. Build it once, abandon it, and it becomes actively misleading.
A Real Scenario
A used-and-new shop with roughly $340k in annual revenue across four channels was convinced their marketplace business was a solid earner because it did about $6k a month in sales. When they finally ran everything through one consistent cost stack, marketplace was netting close to nothing after fees, packing labor, and a return rate they'd never tracked. Meanwhile their monthly book-club subscription — which they'd nearly cancelled twice — was quietly their second-most profitable channel on a lifetime basis.
They didn't kill marketplace. They pruned it. Dropped around 40% of listings that couldn't absorb the fee stack and kept only books where the margin held up. Marketplace revenue fell to roughly $4k/month, but net contribution went up, and they got back a chunk of the packing hours they'd been pouring into money-losing shipments. Those hours shifted toward the subscription, which grew.
Net effect over the following two quarters: noticeable improvement in overall store contribution with slightly lower total revenue. Revenue went down, profit went up, because they finally knew which channel was which.
Where the Workbook Lives, and How It Stays Current
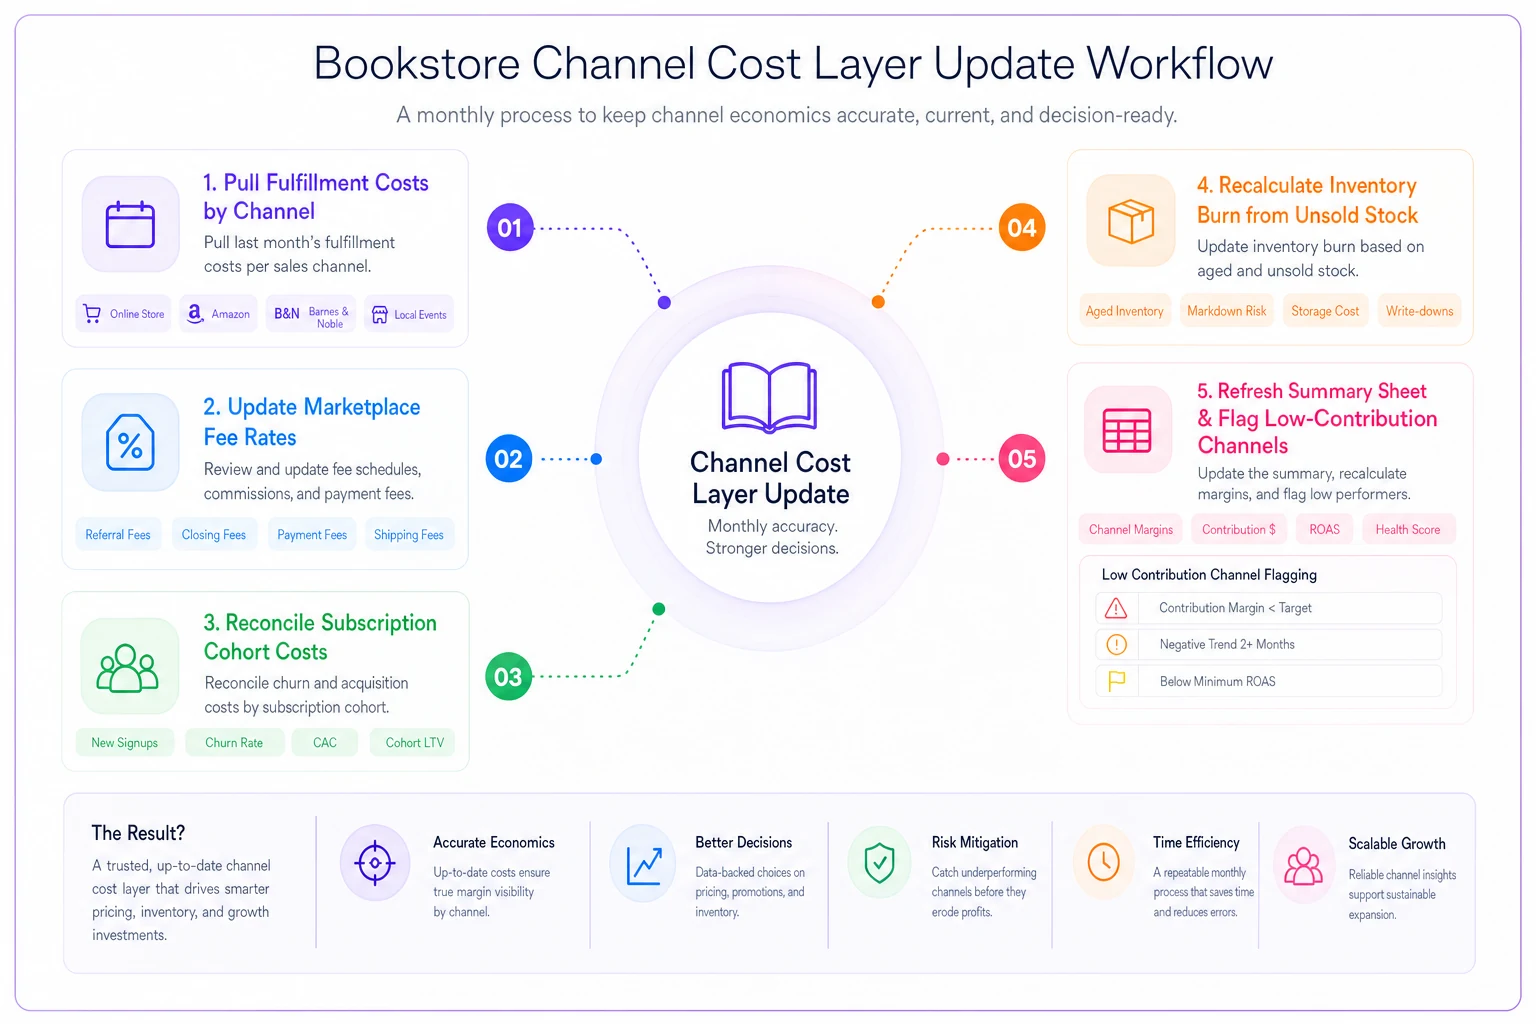
The manual version is a spreadsheet with a tab per channel feeding into a summary sheet — completely doable, and honestly where you should start. The friction isn't building it; it's feeding it. Fulfillment costs drift, marketplace fees change, churn moves, inventory ages. A model that isn't refreshed becomes decoration.
-
Step 1
Pull current fulfillment costs per channel (monthly)
-
Step 2
Update marketplace fee rates if changed
-
Step 3
Reconcile churn and acquisition cost for subscription cohort
-
Step 4
Recalculate inventory burn from unsold/aged stock
-
Step 5
Refresh summary sheet — flag any channel contribution below threshold
This is the one place where operational software genuinely earns its keep for a small store — not by replacing judgment, but by keeping the inputs live. When point-of-sale, marketplace sync, and shipping data flow into one place, the four cost layers update on their own instead of waiting for you to find a free Sunday. AI-assisted reconciliation can flag when a channel's per-order contribution slips below a threshold, or when an event's unsold-inventory burn is quietly dragging the true result underwater — connections that are easy to miss when the relevant costs land weeks apart. The model is the thinking; the automation just keeps it honest between quarters.
Below is a visual of the channel cost layer update cycle.
This is the one place where operational software genuinely earns its keep for a small store — not by replacing judgment, but by keeping the inputs live.
The Takeaway
Comparing channels on revenue is how stores end up subsidizing their worst performers with their best ones for years without noticing. A unified profitability model doesn't require fancy tools or an accounting degree — it requires one commitment: every revenue stream passes through the same four cost layers, no exceptions.
Do that consistently, and the questions that used to feel like gut calls — keep the events, prune the marketplace, grow the box — turn into decisions you can actually see behind. Build it once, keep the inputs current, and let it change your mind at least once a quarter. That's when you know it's working.
Comparing channels on revenue is how stores end up subsidizing their worst performers with their best ones for years without noticing. A unified profitability model doesn't require fancy tools or an accounting degree — it requires one commitment: every revenue stream passes through the same four cost layers, no exceptions. Do that consistently, and the questions that used to feel like gut calls — keep the events, prune the marketplace, grow the box — turn into decisions you can actually see behind. Build it once, keep the inputs current, and let it change your mind at least once a quarter. That's when you know it's working.
Ready to elevate your bookstore’s operations?
Join 500+ bookstores using Bookstorely to boost sales, optimize stock, and delight book lovers.