



Most indie bookstores track gross margin religiously — that comfortable 40% spread between wholesale cost and list price. But when you actually map what happens between clicking "print label" and depositing the payment, the real margin on marketplace orders can shrink to single digits or go negative entirely.
The problem isn't obvious until you lay out every cost component. A $24.99 hardcover might show a healthy $10 margin in your POS system, but after marketplace fees eat $3.75, shipping takes $4.20, packaging costs $0.85, labor allocation adds $2.40, and you factor in a 3% return rate costing another $0.75 in round-trip shipping and restocking — you're left with $0.95. Less than 4% net margin on what looked like a solid sale.
This breakdown matters when you're deciding whether to match Amazon's pricing, which channels actually make money, or whether bulk library orders are worth the discounted rates plus special handling.
Building your bookstore per-order margin waterfall
The waterfall approach tracks how each cost layer strips away margin, starting from list price and flowing down to actual cash in pocket. Unlike a standard P&L that spreads costs across all sales, this method assigns real costs to individual orders.
Start with your list price. Not some theoretical MSRP — what the customer actually pays. For marketplace orders, this might already be discounted to stay competitive. For direct website sales, you might hold full price but offer free shipping above certain thresholds. First deduction is wholesale cost — typically 55-60% of list for new books from major publishers, though small press titles often run 45-50% and used books vary based on your intake model. Academic publishers might give you 20-25% short discount, making those special orders particularly tight. Next comes the marketplace bite. Amazon takes 15% plus $1.80 per item for books. eBay runs 13.25% for most sellers. Biblio and AbeBooks hover around 13-15% including payment processing. Your own website through Shopify or Square costs 2.9% plus $0.30 per transaction, but you avoid marketplace commissions entirely. Packaging materials seem minor but compound fast. A standard book mailer runs $0.35-0.50, bubble wrap or paper fill adds $0.15-0.25, branded inserts or bookmarks cost $0.05-0.10, and printed invoices with toner allocation hit around $0.03. For rare or signed editions requiring rigid mailers and extra protection, packaging alone can exceed $2.00 per order. Labor allocation gets messy because most bookstores don't track pick-and-pack time accurately. A typical single-book order takes roughly 3-5 minutes from printing the pick list to applying the shipping label. At $15/hour, that's $0.75-1.25 in direct labor. Multi-book orders actually reduce per-item labor — a 5-book order might take 8 minutes total, dropping per-book labor to around $0.40.
The diagram below shows the per-order waterfall workflow.
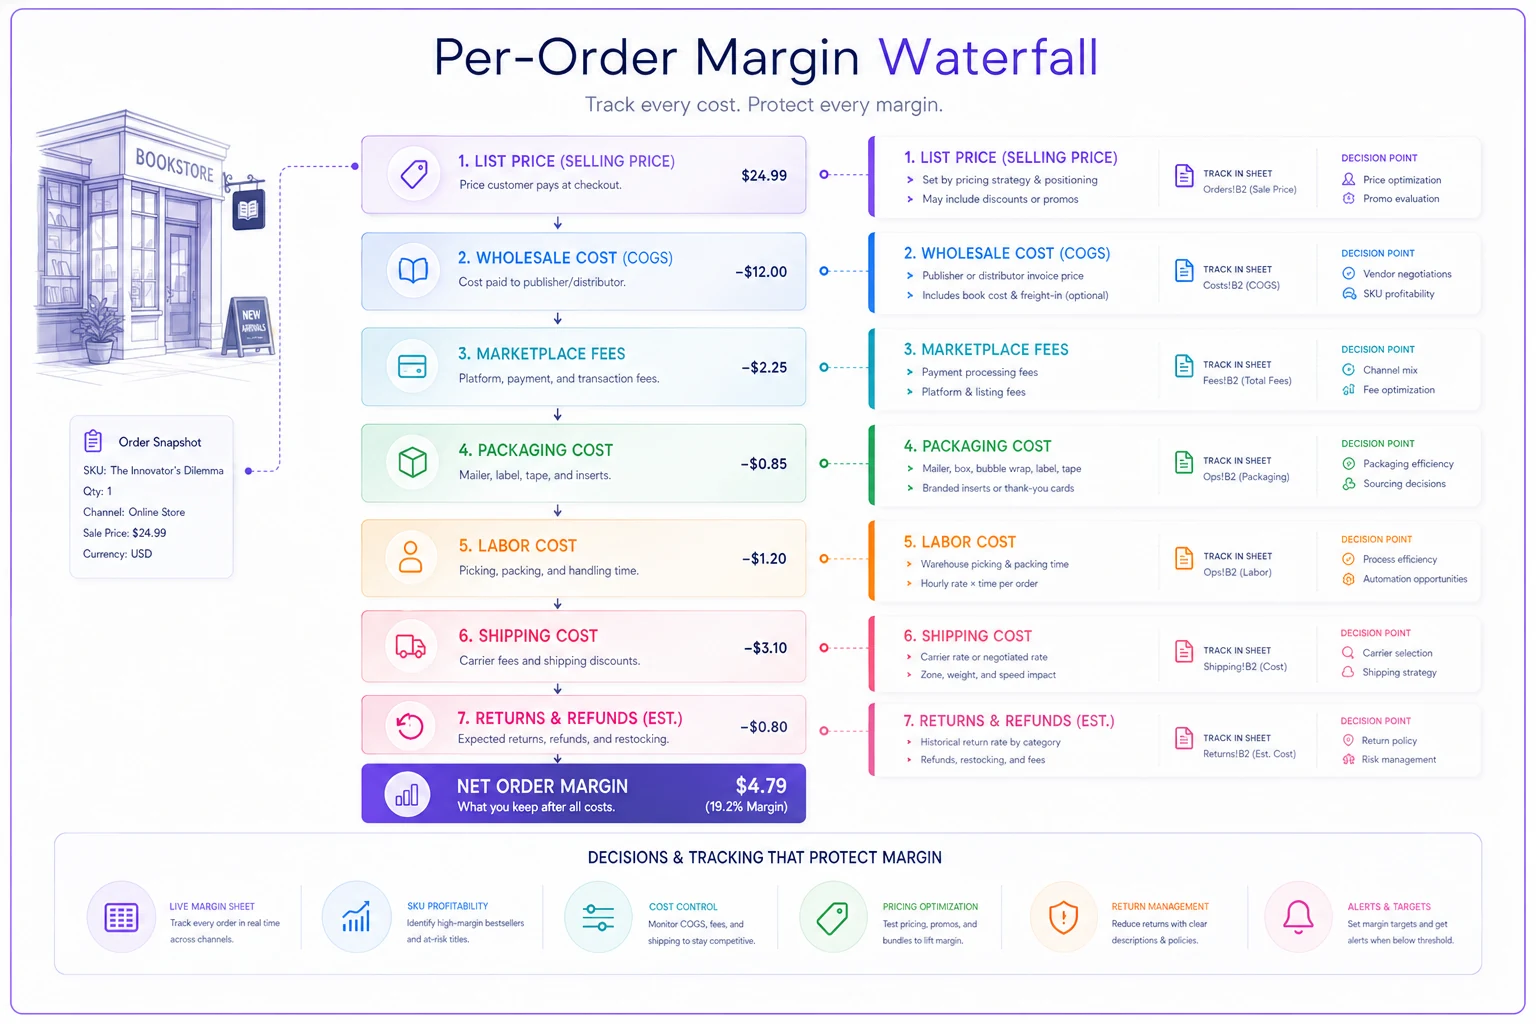
Use this visual to map each cost layer against individual orders.
The shipping calculation that kills margins
Shipping deserves its own section because it varies so dramatically based on weight, zone, and service level. A standard trade paperback at 12 ounces costs $4.50-5.50 via USPS Media Mail to Zone 5-8. That same book via Priority Mail jumps to $9.20-13.50. UPS Ground might run $8.75-11.25 depending on your negotiated rates.
Operational decisions compound costs in ways that aren't obvious upfront. If you're drop-shipping from your distributor, you might pay $6.50 flat rate but lose control over packaging quality and can't include marketing materials. If you're fulfilling from store inventory, you can batch shipments and use regional carriers for 20-30% savings on local deliveries — but you need enough volume to make daily pickups worthwhile. International orders are another margin trap. A book to Canada via USPS First-Class International runs $15-18. Priority International jumps to $35-45. Many stores just exclude international shipping entirely, but that cuts off a meaningful slice of potential marketplace sales. Some stores work around this by partnering with a fulfillment service near the border for Canadian orders, though it adds complexity and needs volume to justify. Free shipping thresholds need careful math. Offering free shipping over $35 might lift average order value by 40%, but if most customers barely clear the threshold with a $37 order, you're absorbing $5-6 in shipping costs that wipe out the incremental margin. Better to set thresholds around your actual shipping cost breaks — USPS Cubic pricing kicks in at certain dimensions, and regional carriers often have weight breaks at 3, 5, and 10 pounds.
Returns and damaged shipments — the hidden margin killer
Return rates vary a lot by channel and category. Direct website sales typically see 1-2% returns. Amazon marketplace orders run 3-5% for general titles but spike to 8-10% for textbooks around semester changes. Rare and collectible books can hit 4-6% due to condition disputes.
-
Original outbound shipping (unrecoverable)
-
Return shipping (sometimes you pay, sometimes the customer)
-
Labor to process, inspect, and restock (5-8 minutes)
-
Potential condition downgrade reducing resale value
-
Marketplace fee that might not get refunded
-
Lost opportunity cost while the book was in transit
A $30 book that comes back might cost $12-15 in total return-related expenses. Build this into your margin waterfall by multiplying your channel-specific return rate by the full return cost.
Damage claims add another layer. Despite careful packaging, 0.5-1% of shipments arrive damaged. Media Mail's rougher handling pushes this to 1.5-2% on some routes. Insurance runs $2-3 per $100 of coverage, but self-insuring makes sense if you keep damage rates below 1% through proper packaging standards.
Your complete margin waterfall template
Here's a worked example for a $26.99 hardcover sold on Amazon:
| Line Item | Amount | Running Margin |
|---|---|---|
| List Price | $26.99 | $26.99 |
| Wholesale Cost (58%) | -$15.65 | $11.34 |
| Amazon Fees (15% + $1.80) | -$5.85 | $5.49 |
| Packaging Materials | -$0.75 | $4.74 |
| Labor (4 min @ $15/hr) | -$1.00 | $3.74 |
| Shipping (Media Mail Zone 5) | -$5.25 | -$1.51 |
| Return Reserve (4% × $8) | -$0.32 | -$1.83 |
| Net Order Margin | -$1.83 |
This order loses money despite starting with a 42% gross margin. The fix might be raising the price, requiring a minimum order, or shifting this title to in-store only.
For comparison, the same book sold in-store:
| Line Item | Amount | Running Margin |
|---|---|---|
| List Price | $26.99 | $26.99 |
| Wholesale Cost (58%) | -$15.65 | $11.34 |
| Credit Card Fee (2.6% + $0.10) | -$0.80 | $10.54 |
| Bag/Receipt | -$0.05 | $10.49 |
| Net Order Margin | $10.49 |
The in-store sale captures 38.9% net margin versus -6.8% for the marketplace order. That gap explains why some stores use online channels purely for inventory turns rather than profit.
Quick audit checklist for monthly margin reviews
Running a full margin analysis on every SKU would paralyze operations. Instead, audit your highest-volume items monthly and spot-check the problematic categories.
Monthly Quick Audit (2 hours maximum):
Pull your top 20 online SKUs by unit volume. Calculate actual net margin using the waterfall for each. Flag anything below 10% net margin for review.
Check your last 50 marketplace orders. Count single-item orders versus multi-item. Single-item orders under $25 rarely generate positive margin after shipping.
Review returns from the past month. Calculate the true cost per return including labor and shipping. If certain titles or categories show return rates above 5%, consider pulling them from online channels.
Compare your free shipping threshold to actual order values. If 60%+ of orders are within $5 of the threshold, customers are optimizing against you — raise the threshold or kill it.
Spot-check five random orders for accurate shipping charges. Dimensional weight surprises, zone miscalculations, and wrong service levels can leak 10-15% margin without anyone noticing.
Category-Specific Checks:
Used and collectible books need different packaging standards and often require insurance. Add $2-3 per order minimum for these categories.
Children's board books and picture books often trigger dimensional weight pricing. A 2-pound picture book might cost $8-12 to ship despite qualifying for Media Mail.
Academic titles with short discounts (20-25% margin) can't support free shipping or marketplace fees. These need special pricing rules or channel exclusions.
Subscription box fulfillment requires its own margin calculation — pick-and-pack labor for multiple items, custom packaging, and higher return rates from surprise selections all change the math considerably.
When to exclude titles from online channels
Not every book belongs on every channel. The margin waterfall helps surface systematic problems that optimization alone won't fix.
Books priced under $15 rarely work on marketplaces after fees and shipping. The exception is bundling multiple low-price titles as sets.
Heavy coffee table books and atlases trigger dimensional shipping rates that can exceed the book's margin. These work better as in-store exclusives or special-order items with shipping passed to customers.
Print-on-demand titles often come with 35-45% wholesale costs, leaving almost no room for marketplace fees. Better to special-order these directly for customers than stock and list them online.
Textbook arbitrage — buying low during buyback season and selling high at semester starts — looks profitable until you factor in the 8-10% return rate and long holding periods. The capital tied up often generates better returns in frontlist fiction.
Operational software and margin tracking
Manually calculating margins on every order would require a dedicated analyst. This is where operational software with built-in cost allocation makes a real difference — the gap between guessing and actually knowing your margins.
Modern bookstore management platforms can automatically assign packaging costs based on order weight, calculate zone-based shipping, allocate labor using standard pick times, and track channel-specific return rates. Instead of monthly spot-checks, you get real-time margin visibility on every order as it moves through fulfillment.
Automate packaging and labor allocation rules so margin visibility is updated per order rather than as a monthly guess.
The automation extends to decision rules too — automatically excluding items below margin thresholds from certain channels, adjusting prices based on competitive monitoring while holding minimum margins, or flagging orders that need manual review before they ship.
More sophisticated platforms use AI automation to surface margin optimization opportunities that manual analysis would miss entirely. Patterns like orders from certain ZIP code ranges consistently costing more to ship than expected, or specific categories generating outsized return rates on a particular channel, start becoming visible when you're analyzing thousands of orders rather than a monthly sample.
The real leverage comes from connecting margin data to purchasing decisions. If your waterfall shows literary fiction generating 12% net margins on marketplace orders while mystery generates 18%, you can shift your buying mix accordingly. That kind of insight is hard to act on when you're pulling it from a spreadsheet once a quarter.
The bottom line on order-level profitability
Running a per-order margin waterfall usually surfaces uncomfortable truths. That aggressive marketplace expansion might be generating revenue while quietly destroying profit. Those match-the-competition prices could be turning would-be profitable sales into subsidized book donations.
Pulling back from online sales isn't always the answer. Sometimes raising prices by $2-3, tightening free shipping thresholds, or excluding a few problematic categories can flip an unprofitable channel into one that actually contributes. Other times the data just confirms what you suspected — some channels aren't worth the operational overhead.
The real shift is moving from aggregate metrics to order-level understanding. A store running 35% gross margin and 5% net might be hiding a reality where half the orders generate 15% margins while the other half lose money. Fix the losing half, and that 5% net can jump significantly without any increase in sales volume.
Track your true costs, make decisions based on complete margin pictures, and stop subsidizing the orders that drag everything else down. The spreadsheet work is tedious — but it's the difference between hoping you're profitable and actually knowing where every dollar goes.