

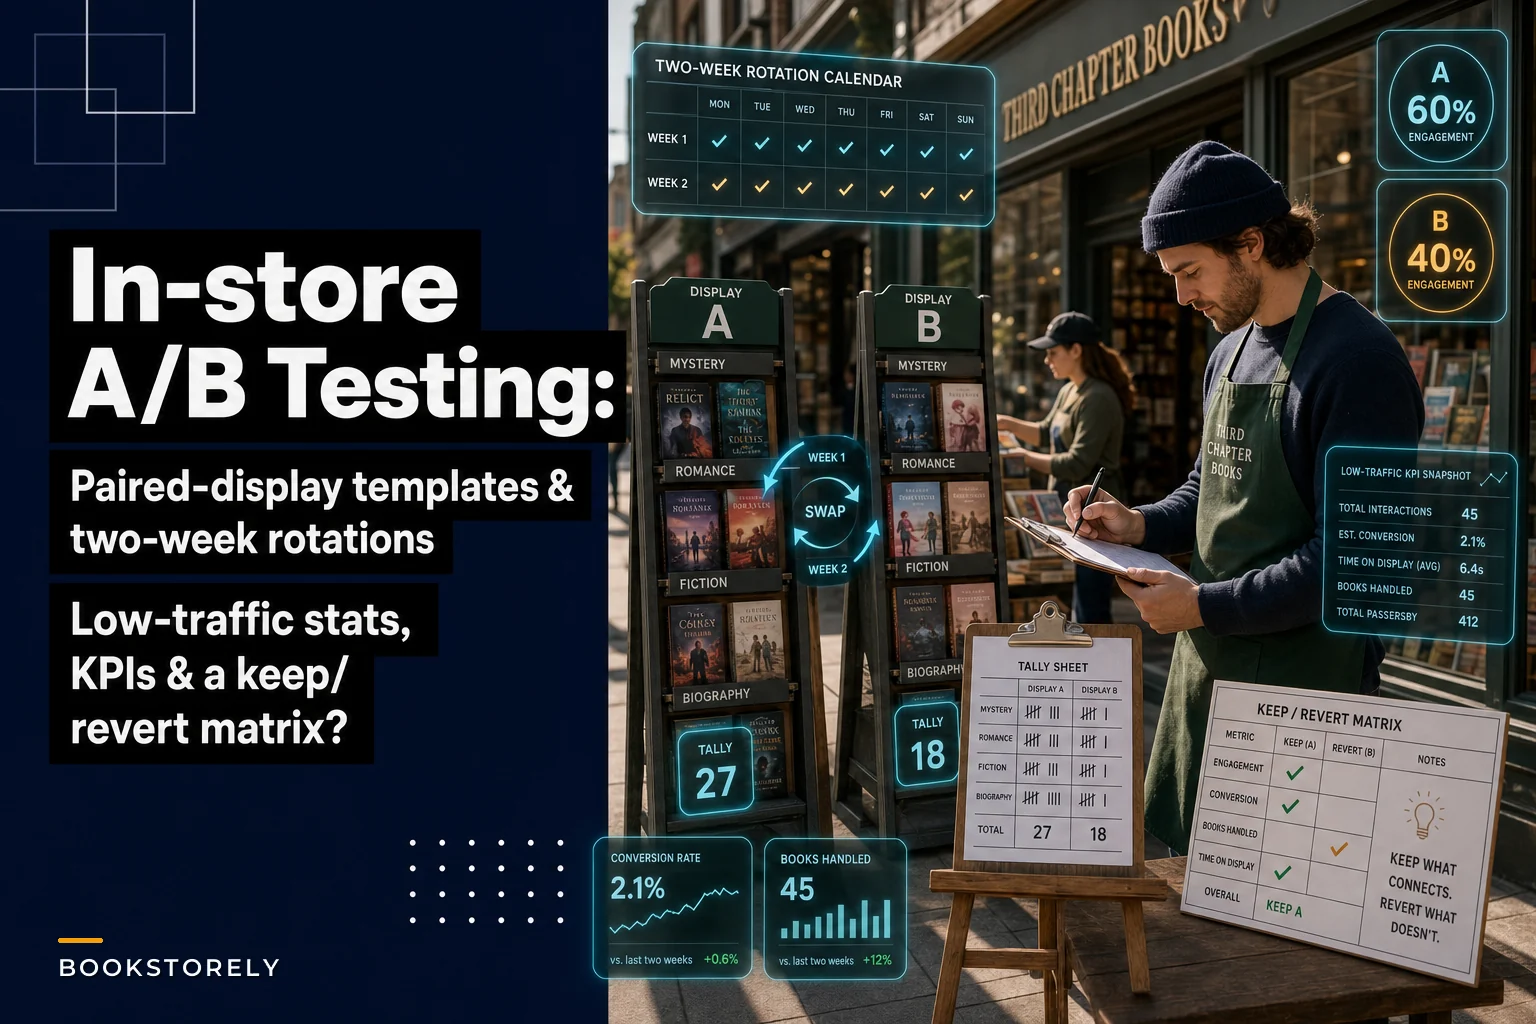

Most bookstore in-store A/B testing fails before it starts. Not because the ideas are bad, but because bookstores run tests wrong—comparing this Tuesday to last Tuesday when one had rain and the other had a street festival. Or they test a new display for three days, see four extra sales, and declare victory without realizing the sample size makes those results meaningless.
The real challenge isn't coming up with test ideas. It's running experiments that actually tell you something useful when you're dealing with 30-80 customers a day instead of thousands of website visitors. Standard A/B testing math breaks down at this scale. You need different approaches.
Why bookstore experiments produce garbage data
Small bookstores face three fundamental testing problems that chain stores don't have. Low traffic means waiting weeks for statistical significance on simple tests. External factors—weather, local events, even which staff member is working—create more noise than signal. And most bookstore owners don't have the statistical background to know when results mean something versus when they're just seeing random variation.
The most common mistake is sequential testing: run one approach for a week, switch to another the next week, see higher sales in week two, and change everything. What they don't realize is week two had a local author event that drove extra foot traffic, which completely invalidates the comparison.
Even when stores try to control for these factors, they rarely collect enough structured data. They'll track total sales but not browse time, conversion rates by section, or customer demographics. Without that context, you can't separate a genuine improvement from a lucky streak.
The paired-store method (when you have multiple locations)
If you operate two or more locations, paired testing gives you the cleanest results. Run different approaches simultaneously across stores, then compare relative performance changes rather than absolute numbers.
The basic framework: Store A implements the test condition while Store B maintains the control. After two weeks, swap—Store B gets the test condition while Store A returns to control. This rotation controls for store-specific factors and doubles your data collection speed.
Setting this up requires at least four weeks of baseline metrics from both stores before you start. You need to understand each store's normal patterns and variance. A location that typically does $2,800 on Tuesdays with a standard deviation of $400 needs different success thresholds than one averaging $4,200 with $200 variance.
The critical tracking elements:
-
Daily customer count (not just transactions)
-
Sales by daypart (morning/afternoon/evening)
-
Units sold by category tested
-
Average transaction value
-
Browse-to-buy conversion in test sections
You're not comparing Store A's $3,200 Tuesday to Store B's $2,900 Tuesday. You're comparing Store A's 14% increase over its baseline to Store B's 3% decrease from its baseline. Relative change matters more than absolute numbers.
Single-store rotating displays (the realistic option)
Most independents have one location, so you need within-store testing methods. The rotating display approach works by testing multiple conditions simultaneously in different sections, then rotating those conditions every few days.
Start by selecting three or four comparable sections—similar traffic patterns, similar baseline sales, similar customer demographics. Mystery, romance, general fiction, and biography often work well together. Avoid mixing high-traffic sections like new releases with low-traffic areas like poetry.
A rotation schedule might look like:
Week 1:
-
Monday-Tuesday
Mystery gets face-out display, Romance gets table feature, Fiction gets staff picks, Biography stays standard
-
Wednesday-Thursday
Romance gets face-out, Fiction gets table, Biography gets picks, Mystery returns to standard
-
Friday-Saturday
Fiction gets face-out, Biography gets table, Mystery gets picks, Romance standard
-
Sunday
Biography gets face-out, Mystery gets table, Romance gets picks, Fiction standard
Week 2: Repeat the same rotation to build sample size.
This controls for day-of-week effects while testing multiple conditions at once. Each section serves as both test and control throughout the cycle. After two weeks, you have eight data points per condition per section—enough to spot real patterns versus noise.
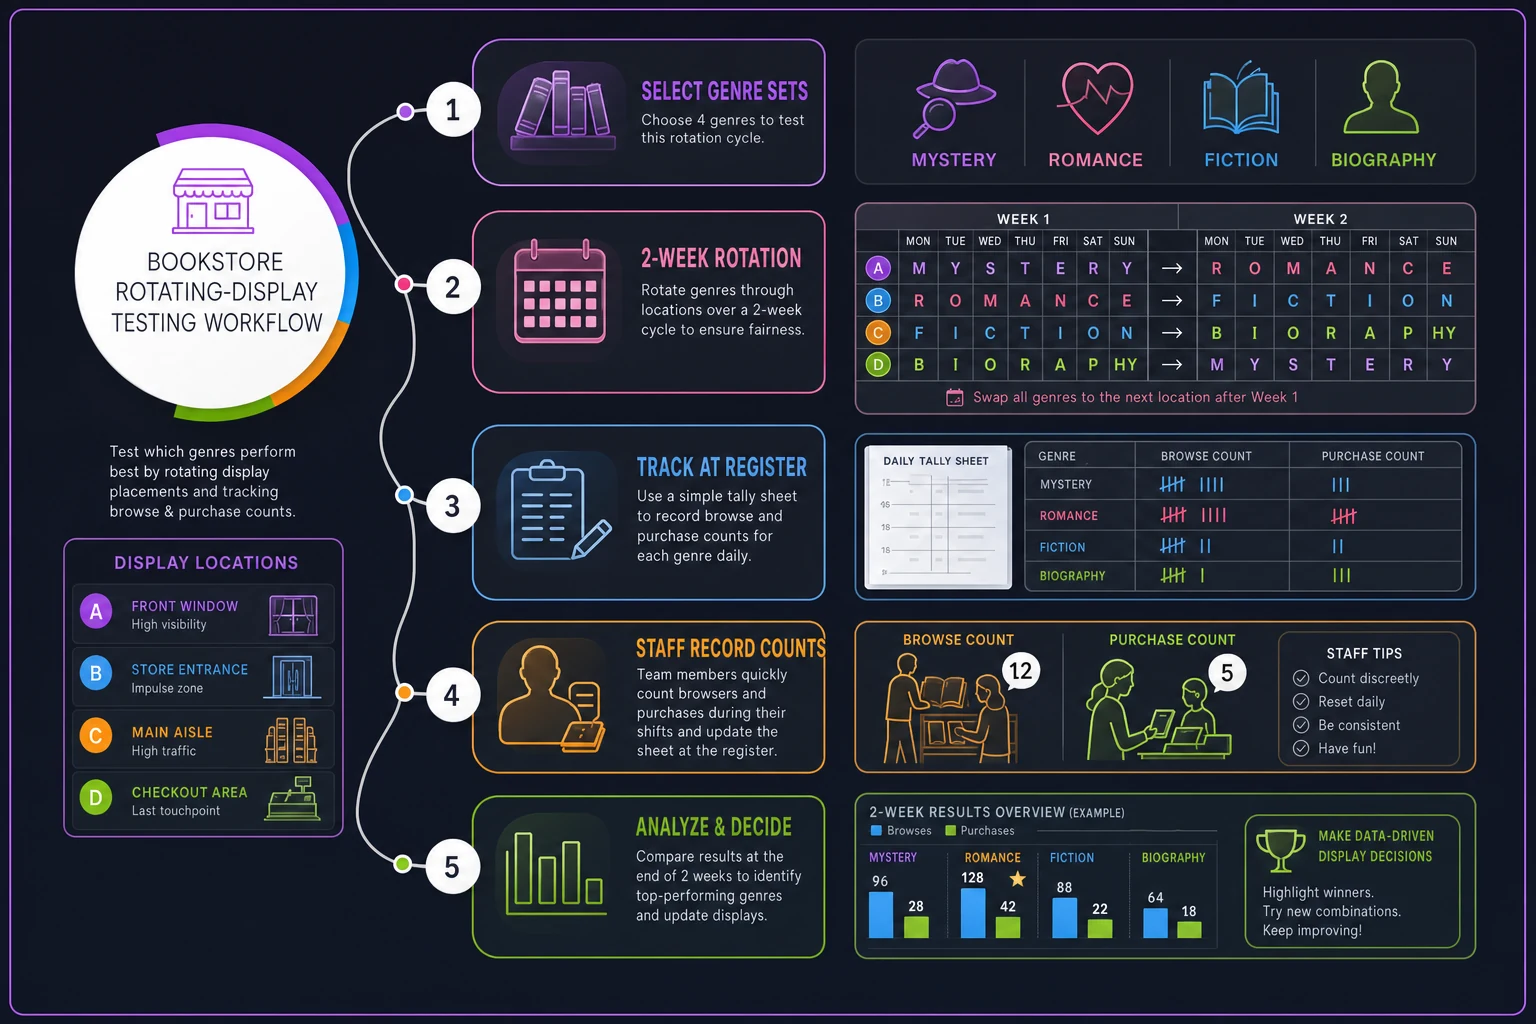
The data capture challenge is tracking section-specific metrics without disrupting operations. Many POS systems can track sales by category, but you'll need manual counts for browse time and customer interaction. A simple tally sheet at the register works fine: hash marks for customers who browsed each test section, circles for those who purchased.
Statistical significance with 40 daily customers
Traditional A/B testing calculators assume thousands of observations. When you're seeing 40-80 customers daily—maybe 10-15 interacting with your test sections—standard statistical significance becomes almost impossible in reasonable timeframes.
Stop chasing 95% confidence intervals. Focus on effect sizes and practical significance instead. A display change that increases section conversion from 3 customers per day to 4 represents a 33% improvement. Even with small samples, consistent directional improvements across multiple test cycles suggest real impact.
The minimum viable sample depends on your baseline conversion rate and the size of improvement you're trying to detect. If your fiction section typically converts 8% of browsers to buyers—roughly 3-4 sales from 40-50 browsers weekly—detecting a 50% improvement (to 12% conversion) requires around 250 observations per variant. That's about two weeks per test condition in a moderate-traffic section.
Detecting smaller improvements, like 8% to 10% conversion, would need closer to 1,000 observations per variant. That's just not realistic for most single-location testing, which is why you focus on bigger swings and multiple validation cycles.
A practical approach: run your test for two weeks, look for directional improvements of 20% or more, then validate by reversing the test for a week. If metrics drop back toward baseline, run the test again. Consistent patterns across these cycles provide real confidence even without statistical significance.
The keep/revert decision matrix
After two weeks of testing, you need a framework for deciding whether to keep changes or revert. Raw sales data isn't enough—you also need to factor in operational complexity, staff feedback, and shifts in customer behavior.
Build your decision matrix around four factors:
Performance metrics (40% weight):
-
Sales lift
Minimum 15% increase to justify any operational change
-
Conversion improvement
Browse-to-buy ratio must improve by 10%+
-
Basket impact
Changes shouldn't reduce average transaction value
Operational burden (30% weight):
-
Setup time
Can staff execute this in under 10 minutes daily?
-
Maintenance needs
Does it require constant adjustment?
-
Training requirements
Can new staff learn it in one shift?
Customer experience (20% weight):
-
Browse time
Are customers spending longer in sections (good) or looking confused (bad)?
-
Staff interactions
Are customers asking more questions (could be good or bad)?
-
Complaint/compliment ratio
Direct feedback matters even in small samples
Sustainability (10% weight):
-
Inventory implications
Does this require holding more frontlist stock?
-
Space efficiency
Are you sacrificing capacity for marginal gains?
-
Scalability
Can you replicate this across other sections?
| Factor | Weight | Criteria |
|---|---|---|
| Performance metrics | 40% | Sales lift: Minimum 15% increase to justify any operational change; Conversion improvement: Browse-to-buy ratio must improve by 10%+; Basket impact: Changes shouldn't reduce average transaction value |
| Operational burden | 30% | Setup time under 10 minutes daily; Maintenance needs; Training learnable in one shift |
| Customer experience | 20% | Browse time effects; Staff interactions; Complaint/compliment ratio |
| Sustainability | 10% | Inventory implications; Space efficiency; Scalability |
Score each factor from -2 (much worse) to +2 (much better), multiply by weights, sum for a total score. Positive totals suggest keeping the change, negative scores suggest reverting. Anything between -0.3 and +0.3 means you need more testing time.
This framework prevents the common mistake of keeping changes that boost sales 8% but require 30 minutes of daily staff attention—that time almost always generates more value somewhere else.
Test ideas that actually matter
Not every test is worth running. Skip the tiny tweaks and focus on changes that could meaningfully impact operations. The best tests address specific friction points or bottlenecks you've already identified.
High-impact display tests:
-
Genre adjacency
Which categories perform better next to each other
-
Height positioning
Eye-level versus waist-level versus ankle-level placement
-
Depth variations
3-deep versus 5-deep versus 7-deep facing
-
Signage styles
Handwritten shelf-talkers versus printed signs versus no signage
Conversion-focused tests:
-
Staff pick positioning
Integrated within sections versus dedicated displays
-
Bundle presentations
Physical bundles versus "pairs well with" signage
-
Price point mixing
Alternating premium and value titles versus grouping by price
Traffic flow tests:
-
Power aisle arrangements
What pulls customers deeper into the store
-
Checkout proximity effects
What sells better near versus far from registers
-
Dead zone activation
Testing ways to energize low-traffic areas
Each test should connect to a specific business goal. Testing face-out displays in poetry might be statistically interesting, but it won't meaningfully move the needle for a store doing $800k annually where poetry represents half a percent of sales.
Real data capture without drowning in spreadsheets
The biggest testing failure point isn't bad test design—it's inconsistent data collection. A well-designed test becomes worthless if you only capture data for six of fourteen days because staff got busy or forgot.
Design capture forms that take under 30 seconds to complete.
Design capture forms that take under 30 seconds to complete. A half-sheet with pre-printed sections, checkboxes for common observations, and minimal write-in fields. Date and daypart pre-printed if possible. Staff should only need to add tally marks and circle relevant options.
Essential daily metrics:
-
Door count (total customers entering)
-
Section interaction count (customers who stopped to browse test sections)
-
Conversion count (purchases from test sections)
-
Notable events (author visit, weather, construction, etc.)
Weekly rollup additions:
-
Average transaction by section
-
Return rate for test sections
-
Staff effort observations
-
Customer comment themes
Store this in a simple grid—date down the left, metrics across the top. Calculate rolling averages weekly but don't obsess over daily variance. Look for multi-day trends and week-over-week patterns.
The most successful tracking happens when one person owns it. Rotating responsibility creates inconsistent capture. Better to have an assistant manager handle all test tracking than to distribute it across the team. That person should also do the weekly rollups and flag anything that looks off.
Common testing mistakes that wreck results
Operational mistakes contaminate more bookstore tests than statistical errors do. The classic one: testing a new display approach while also bringing in fresh inventory that week. Now you can't separate display impact from new product appeal.
Maintenance decay is another one that shows up constantly. Week one of a face-out display test looks great—everything perfectly arranged, signs fresh, staff engaged. By week two, books are askew, signs are dog-eared, and attention has moved on. The performance drop might reflect maintenance issues rather than display effectiveness.
Informal staff steering is subtler but just as damaging. Enthusiastic employees unconsciously guide customers toward test displays they personally prefer. That biography table performs great when Jennifer works but drops noticeably when she's off. At that point you're testing Jennifer's sales ability, not display effectiveness.
Abandoning tests too early might be the most expensive mistake. A display shows no improvement after four days, so you scrap it. But bookstore purchases often have long consideration cycles—that customer who browsed your test display on Tuesday might not buy until Saturday. Two-week minimums exist for a reason.
Geographic bias also creeps in. Testing new signage only in front-of-store displays ignores that those sections naturally get more traffic. The signage might fail completely mid-store, where you actually need the boost.
Building testing into regular operations
The stores that test successfully don't treat it as a special project. They build lightweight experimentation into their regular operational rhythm—one active test, one results review, one planning session per month.
This means accepting that some portion of your store is always in flux. Pick your testing zones—maybe 10-15% of total floor space—and assume these areas rotate through different configurations monthly. Staff learns to expect change in those zones rather than being surprised by constant modifications.
Budget 2-3 hours weekly for test administration:
-
30 minutes for Monday setup/rotation
-
20 minutes for daily data capture (accumulated)
-
30 minutes for Friday weekly rollup
-
40 minutes for analysis and planning
This structured time investment keeps testing from becoming an overwhelming addition to regular duties. It's similar to the systematic approach needed for event planning, where consistent process matters more than perfection.
Your testing calendar should also account for seasonal patterns and known disruptions. Don't test during the week between Christmas and New Year's. Don't start new tests the week of your biggest annual sale. Build the schedule around your business rhythm, not despite it.
Keep a simple testing log—what you tested, when, what happened, what you learned. After a year, you'll have a dozen completed experiments with real data about what actually moves the needle in your store with your customers.
Making sense of messy results
Real-world test results rarely show clean victories. More often you see mixed signals—sales up 12%, but returns increased 20%. Or conversion improved in mornings but declined in evenings. These require structured interpretation, not gut calls.
Start with your primary success metric. If the test aimed to increase section sales, that's your north star. Secondary metrics provide context but shouldn't override primary goal achievement. A display test that increases poetry sales 30% succeeded, even if browse time dropped slightly.
Look for interaction effects between metrics. Increased returns might be acceptable if they come with proportionally larger sales increases—customers taking more chances because the display makes books more appealing. Net effect still favors the change.
Consider confidence intervals even with small samples. A test showing 8-18% improvement (wide interval due to small sample) might be worth keeping if downside risk is minimal. A test showing -5% to +25% probably needs more data before making permanent changes.
When results genuinely conflict—significant sales increases alongside significant operational burden—return to the decision matrix. Weight the factors, score them honestly, and let the framework guide you. Gut feelings matter, but structured decision-making prevents expensive mistakes.
Sometimes the right answer is partial adoption. A labor-intensive display approach might only make sense for new releases where ROI justifies the effort, or only during peak seasons when you have extra coverage.
Software tools that make testing less painful
Manual tracking works but introduces error and burden. The right operational software can automate much of the data capture and analysis, turning testing from a special project into a background process.
Modern bookstore platforms can track section-level performance automatically, eliminating manual counts. They'll capture browse patterns, conversion rates, and compare test periods against baselines without daily spreadsheet updates—which means you can run more tests with less friction.
The real value comes from pattern recognition across tests. AI-powered analysis can identify which types of changes consistently work for your store, which customer segments respond to different approaches, and which external factors most influence results. Instead of treating each test in isolation, you build a cumulative understanding of what actually drives performance.
Integration with your POS connects test results directly to financial outcomes. You're not guessing whether that 15% conversion improvement justified the display change—you can see the exact margin impact. That connection makes it easier to get staff buy-in and justify continued experimentation.
For paired-store testing, centralized platforms let you coordinate tests across locations while accounting for store-specific factors. The software handles the complex relative performance calculations while you focus on implementing tests and interpreting what they mean.
Turning test wins into standard practice
The final mile—implementing winning approaches as standard practice—is where most bookstores stumble. They run a successful test, everyone agrees to adopt it, then three weeks later they're back to old habits.
Successful standardization needs three things: clear documentation, integrated training, and regular audits. Documentation shouldn't be a lengthy manual—just a simple one-page reference covering what to do, how to do it, and why it matters. Like the systematic approach needed for damage-free shipping, clarity beats complexity every time.
Build winning approaches into your training process immediately. Don't wait for the next formal training session. A five-minute standup demonstrating the new approach, explaining the test results behind it, and showing the expected impact is enough. When staff understands the "why," compliance improves dramatically.
Schedule monthly audits to verify that winning approaches remain in place. This isn't about catching mistakes—it's about preventing drift. Small adjustments compound. That face-out display showing 18% improvement might be generating only 5% six weeks later because books aren't being properly rotated.
Create feedback loops for refined implementation. The test proved face-out displays work, but maybe your team discovers that alternating face-out with spine-out every other book performs even better. Encourage that experimentation within the proven framework.
And accept that some winning tests have expiration dates. What works in February might not work in July. Seasonal patterns, changing customer demographics, and competitive shifts mean periodically retesting "proven" approaches. Testing isn't a one-time activity—it's an ongoing operational discipline.
The bookstores that thrive don't guess what customers want. They test, measure, and adapt based on real data. Even with low traffic and limited resources, structured experimentation beats intuition. Start with one simple test next Monday, track it properly for two weeks, make a data-driven decision, then start another. Within six months, you'll have real data about what drives results in your specific store—knowledge your competitors are still guessing at.