



Walk into any indie bookstore under 1,500 square feet and you'll spot the same chaos. Fiction spilling into the cookbook section. Staff pick shelves eating up prime real estate while bestsellers hide on lower shelves. New releases competing with backlist titles for the same endcap.
The 900-square-foot reality that breaks most merchandising advice
The problem isn't that these owners don't understand merchandising. It's that traditional retail merchandising systems are built for 5,000+ square feet. When your entire store fits into what Barnes & Noble allocates for romance novels alone, those systems fall apart.
Most bookstore merchandising guides talk about category management like you're running a department store. Dedicate 15% of floor space to children's books, 12% to cookbooks, 8% to local interest. But when you actually try this in a 900-square-foot store, your "children's section" becomes three shelves. Your local interest display? Half an endcap if you're lucky.
The math gets worse when you factor in operational realities. That prime window display everyone says drives walk-in traffic? In a small store, changing it means blocking customer flow for 20 minutes. Your "high-margin impulse zone" near the register? It's also where customers wait during busy periods, where you process online orders, and where staff eat lunch when the back room is buried in inventory.
Why percentage-based floor allocation actually works (when done right)
Here's the counterintuitive part: percentage-based floor allocation becomes more important as your store gets smaller, not less. But you need to calculate it differently.
Start with sellable square footage, not total square footage. In a typical 1,200-square-foot indie bookstore, once you subtract the checkout counter, walkways, door clearance, and that structural column you can't move, you're often working with around 680 square feet of actual merchandising space. That's your real number.
Then break it down by revenue contribution and margin—not industry averages. If local author books generate 18% of your revenue but only need 8% of your space because they turn faster, that's pure profit. Meanwhile, those beautiful art books everyone loves browsing might generate 4% of revenue while eating up 11% of floor space.
Category Space % = (Revenue % × Margin Factor × Velocity Factor) ÷ Sum of All Categories
-
Margin Factor = Category margin ÷ Store average margin
-
Velocity Factor = Category turns ÷ Store average turns
A bookstore in Portland discovered their poetry section—just 2% of revenue—was actually their third most profitable category per square foot. The markup was higher and dedicated poetry buyers would seek them out specifically. They went from one shelf to a curated four-shelf display and saw poetry revenue climb to 3.8% within two months. Nobody expected that going in.
The seasonal template trap (and the 8-week solution)
Every retail consultant will tell you to build seasonal planograms. Summer beach reads, back-to-school, holiday gift guides. But most merchandising systems assume you have dedicated seasonal space that doesn't cannibalize your core categories.
Small bookstores face a different problem. When you shift to summer merchandising, you're not adding beach read displays—you're converting existing space. That biography section becomes travel memoirs. Literary fiction makes room for light summer novels. You're robbing Peter to pay Paul every single time.
The stores that handle this well use what I'd call "swing space"—sections designed to transform completely every 8 to 12 weeks. Usually 15-20% of total selling space, positioned where customers naturally pause rather than at entrances or exits.
Weeks 1-2: Full transformation
-
Complete category swap
-
New shelf talkers and signage
-
Staff picks refresh
Weeks 3-4: Performance measurement
-
Daily unit tracking
-
Which titles get picked up but not purchased
-
Customer comment collection
Weeks 5-6: Adjustment period
-
Swap underperformers
-
Expand winners
-
Add complementary categories
Weeks 7-8: Transition prep
-
Markdown slow movers
-
Order for next season
-
Plan next transformation
The critical piece: don't try to be seasonal everywhere. Pick your swing space, commit to it, and let the rest of the store hold steady year-round.
The 4-week display test that beats gut instinct
Most indie bookstores change displays based on feel. Sales seem slow? Swap the display. New books arrived? Rotate them in. Without any testing methodology, you're just guessing—and guessing consistently expensive.
The paired-display test method fixes this. Instead of changing one display and hoping for improvement, you change two similar displays differently and measure the gap.
Week 1: Baseline measurement
-
Track units and revenue for Display A (front table) and Display B (first shelf unit)
-
Note traffic patterns and dwell time
Week 2: Implement test changes
-
Display A
Switch to face-out presentation, themed selection
-
Display B
Maintain spine-out, alphabetical
Week 3: Measure impact
-
Compare week-over-week changes
-
Account for any external factors (weather, local events)
Week 4: Decision point
-
If Display A outperformed B by 20%+, roll out to similar displays
-
If the difference is marginal, test a different variable
One store tested staff picks versus algorithm recommendations from their distributor's "also bought" data. The algorithm won by 31% in units sold, but staff picks won by 18% in margin dollars. They ended up using algorithm suggestions for volume categories and staff picks for specialty sections. Not a clean answer, but an honest one.
ROI math that takes 5 minutes (not 5 hours)
The biggest complaint about bookstore merchandising systems is that they require complex tracking that small stores don't have bandwidth for. You don't need sophisticated analytics to measure display ROI, though. A few consistent metrics done manually beats nothing.
| Metric | Formula | Tracking Method | Decision Threshold |
|---|---|---|---|
| Display Revenue per Day | Daily sales ÷ Days displayed | POS category report | Must exceed space rental rate |
| Sell-through Rate | Units sold ÷ Units displayed | Weekly count | Below 15%/week = rotate |
| Margin Dollars per Foot | (Revenue × Margin%) ÷ Linear feet | Manual calculation | Must exceed store average |
| Touch-to-Buy Ratio | Units sold ÷ Books touched | Observation sampling | Below 1:8 = wrong audience |
The "space rental rate" concept changes how you think about displays. Calculate your rent per square foot per day (monthly rent ÷ 30 ÷ total square feet). Every display needs to generate at least 3x that amount to justify the space.
For a 1,000-square-foot store paying $3,000/month, that's $3 per square foot per day. A 4-square-foot display needs to pull in $12 daily just to break even on rent, before labor or anything else. Most owners have never thought about it that way, and it changes which displays they're willing to keep.
Category adjacency rules that double browse time
Traditional merchandising puts similar things together. Mystery with thriller. Romance with women's fiction. Small stores can't afford to think that narrowly.
The adjacency principle that actually works: complementary opposition. Put things together that serve the same customer need from different angles.
-
Cookbooks next to diet/health (same goal
eating better)
-
Travel guides next to travel memoirs (same interest
a specific place)
-
Business books next to biography (same reader
someone ambitious)
-
Parenting next to humor (same customer
exhausted parent)
One store moved their gardening books next to cookbooks instead of home improvement. The logic: people interested in growing food might want to cook it. Gardening sales went up 24%. Cookbook sales moved up 11%. Neither change was planned—they just noticed the connection their customers were already making and stopped fighting it.
Think about customer missions, not just categories. Someone buying a French cookbook might be planning a trip, learning the language, or hosting a dinner party. Good adjacency serves all of those at once.
The inventory coordination nightmare nobody talks about
This is what actually breaks most bookstore merchandising systems: the display doesn't match the inventory system. You create a beautiful "Books About Books" display, but your POS still categorizes everything as fiction, memoir, or essays. Three months later, you have no idea what sold from where or whether the display was worth the two hours it took to build.
The fix requires discipline around display codes. Every book on a display gets a temporary secondary category code that follows it through the sale. Most modern POS systems support this—almost nobody uses it properly.
-
DISP-FRONT (front table)
-
DISP-WIN (window)
-
DISP-END1 (endcap 1)
-
DISP-STAFF (staff picks)
Scan each book and add the display code as you place it to avoid a tedious cleanup later.
When building a display, you scan each book and add the code. When it sells, you can track which displays are actually driving purchases. When the display comes down, you bulk-remove the code.
It feels like extra work until you realize it answers the questions that actually matter. That window display you spent two hours putting together? Now you know it generated $847 last week. The staff picks shelf everyone loves? Turns out it's your lowest-performing display per square foot. That's uncomfortable information, but it's useful information.
When to break your own rules (the 20% chaos principle)
The best bookstore merchandising systems aren't really systems—they're frameworks with built-in flexibility. Every successful indie bookstore breaks its own rules some of the time, and the good ones know exactly when that's the right call.
That percentage-based space allocation? Throw it out when an author event demands a 40-book display. Your 8-week seasonal rotation? Skip it when a local news story makes certain topics suddenly relevant. The paired testing methodology? Sometimes you just know something will work.
A bookstore in Austin scrapped their entire merchandising plan when winter storms hit Texas. They built emergency displays overnight: generator guides, winter preparedness, camp stove cookbooks, board games for power outages. Sales jumped 40% during a period when most other stores were closed. No planogram would have told them to do that.
Bookstores aren't just retail stores—they're community spaces. When a local author wins a national award, you don't check your planogram. You build the display that night. The framework matters, but so does knowing when to set it aside.
The automation opportunity everyone misses
Most bookstores track merchandising effectiveness in spreadsheets, if at all. This is where AI-powered operational software can make a genuine difference—not in some flashy way, but in the grinding, repetitive parts of the process that nobody wants to do manually.
Instead of manually calculating display ROI, automated systems can pull POS data, correlate it with display codes, and surface real-time performance without someone spending an hour in Excel. Instead of guessing which categories need more space, the software can analyze sales velocity, margin, and seasonal patterns to flag where your allocation is drifting off target.
The more interesting wins come from pattern recognition over time. A system tracking enough data might notice that poetry sales spike about three weeks before Mother's Day, or that cookbook sales correlate with rainy weekends. Those patterns let you anticipate instead of react, which is a fundamentally different way to run a small store.
One platform built for a bookstore group tracked every book's journey from receiving to sale, including which displays it appeared on. The system identified that books displayed face-out for even a few days before returning to spine-out sold measurably better over their lifetime—even after going back to regular shelving. The stores now rotate face-out displays systematically instead of randomly, and it's had a compounding effect on certain categories.
The biggest practical win is just reducing manual tracking. When you're already managing quarterly buying cycles, adding display performance tracking to the workload feels impossible. Automated systems handle the data collection so staff can focus on what they're actually good at: curating, recommending, and selling books.
If you're thinking about local visibility alongside all this, that's a separate but related problem worth solving at the same time.
Making it work in your store
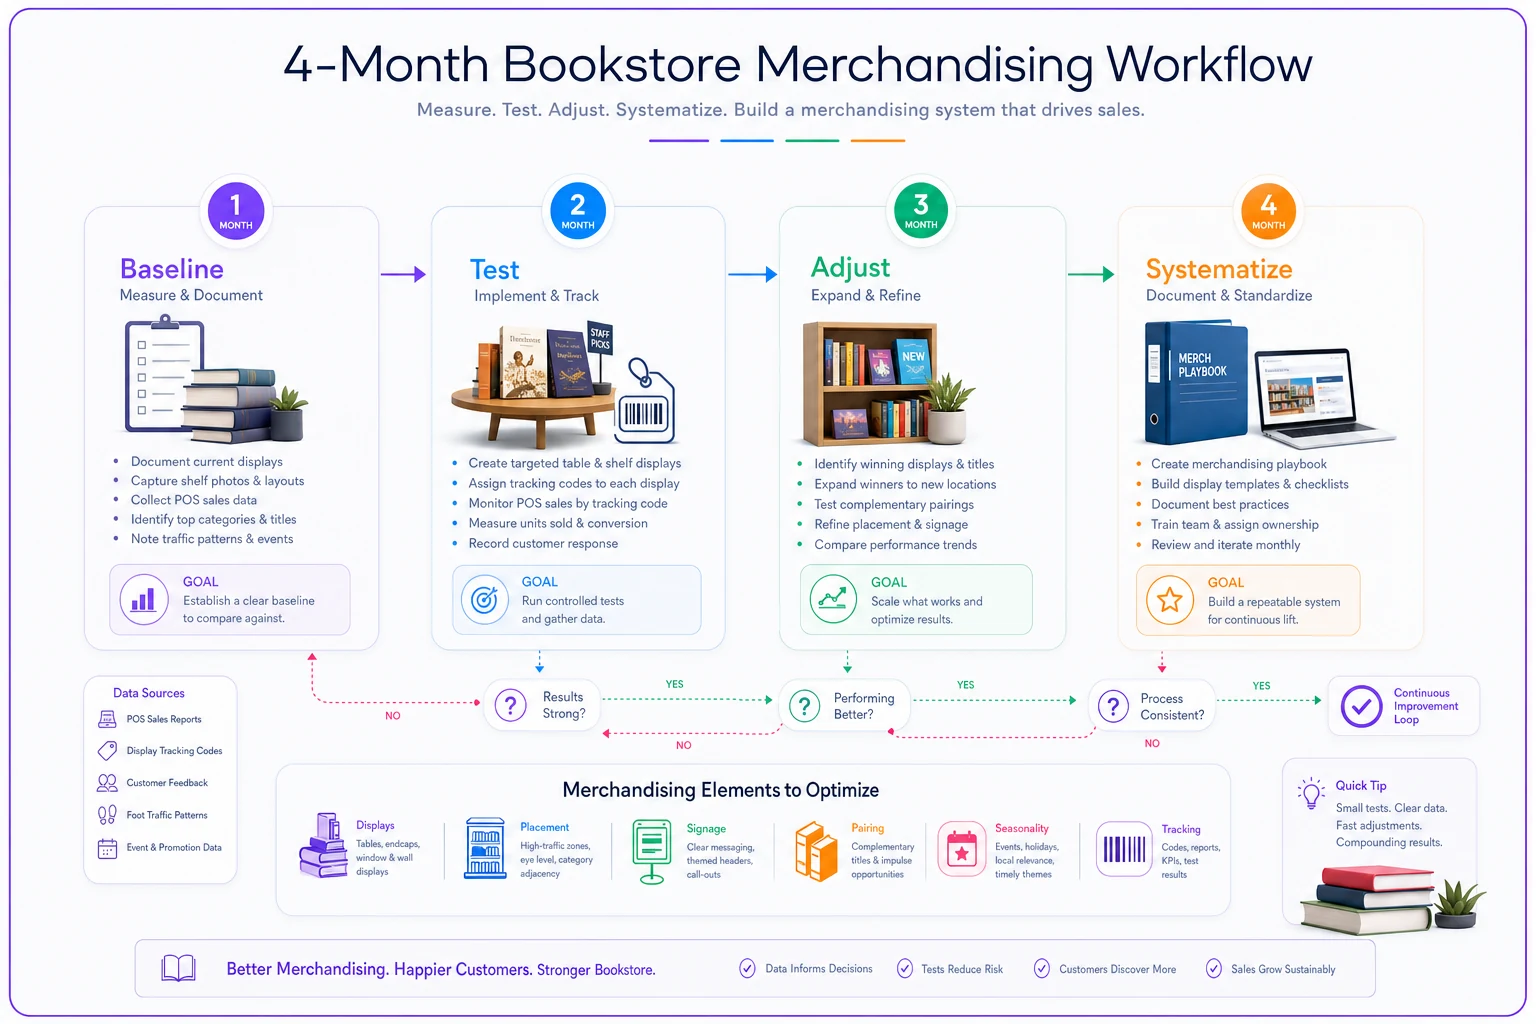
The transition to a systematic merchandising approach doesn't happen overnight, and trying to implement everything at once is a reliable way to implement nothing. Start with one category and one display. Track everything for four weeks. Then expand.
Month 1: Baseline
-
Measure current space allocation
-
Track weekly sales by category
-
Document all display locations
Month 2: First test
-
Pick your highest-margin category
-
Test percentage-based allocation
-
Implement display tracking codes
Month 3: Expand and adjust
-
Add seasonal swing space
-
Start paired display testing
-
Calculate first ROI metrics
Month 4: Systematize
-
Create standard templates
-
Document what worked
-
Plan next quarter's changes
The stores that make this stick share one trait: they measure everything but stay flexible on execution. They know their poetry section generates $4.20 per square foot per week, and they'll still clear it out for a local poet's book launch without thinking twice.
Here's a simple workflow diagram of the monthly rollout.
The math matters. The percentages matter. But bookstores succeed because they understand their specific customers in their specific community. A good merchandising system amplifies that understanding—it doesn't replace it. The percentages, templates, and tests just help you do what you've always done, with a little more confidence behind it.
The math matters. The percentages matter. But bookstores succeed because they understand their specific customers in their specific community. A good merchandising system amplifies that understanding—it doesn't replace it. The percentages, templates, and tests just help you do what you've always done, with a little more confidence behind it.