

Most indie bookstores operate on a broken buying cycle. Orders happen when someone notices empty shelves, when publishers push new releases, or when that one customer asks for something specific. The result? Too much cash tied up in slow movers while bestsellers sit out of stock for weeks.
Bookstores that survive long-term build systematic buying rhythms. Not because they're more disciplined, but because systematic buying actually takes less mental energy than constant reactive ordering.
The Real Cost of Ad Hoc Ordering
Walk into any struggling bookstore and you'll see the symptoms everywhere. New hardcovers stacked three deep while the poetry section has gaping holes. A stockroom full of last season's beach reads while customers leave empty-handed looking for this week's book club pick.
The owner usually knows something's wrong but can't pinpoint it. They're ordering constantly—placing rush orders from Ingram twice a week, grabbing titles from publisher reps whenever they call, filling Amazon orders for single copies. Each order makes sense in isolation. Together, they create operational chaos.
A typical 2,500 square foot bookstore carrying around 8,000 unique titles probably has $85,000–$95,000 tied up in inventory. When ordering happens reactively, about 35% of that capital sits in books that won't sell for six months or more. Meanwhile, they're losing $400–600 weekly in missed sales from stockouts on titles customers actually want.
The math gets uglier when you factor in labor. Store managers spend 8–12 hours per week on ordering tasks when it's all ad hoc. That same work takes 3–4 hours with a quarterly rhythm. That's 200+ hours annually that could go toward events, merchandising, or actually talking to customers.
Why Quarterly Planning Works
Publishers operate on seasonal lists. Spring titles ship January through April. Summer releases May through August. Fall is September through December. Your buying should match this natural rhythm, not fight it.
Never miss a sale or stock shortage again.
Bookstorely helps you manage inventory, orders, and customer relationships seamlessly.
- Integrated inventory tracking
- Customer purchase history
- Sales reporting & analytics
No credit card required
A quarterly cycle gives you three advantages most bookstores miss. First, you can negotiate better terms when placing larger, predictable orders. Publishers and wholesalers care more about order size and consistency than most retailers realize. Second, you can actually use your sales data meaningfully. Trying to forecast demand weekly is noise; quarterly patterns show real trends. Third, cash flow becomes predictable.
The stores that make this work don't have sophisticated systems. They have simple, repeatable processes that match how book publishing actually operates.
Building Your Capital Allocation Framework
Start with your cash reality. Most bookstores turn inventory 3–4 times annually, meaning you need roughly three months of inventory investment available as working capital. For that $90,000 inventory store, you need $22,000–$30,000 in available capital per quarter for purchasing.
Most stores mess up by treating all categories equally. Your romance section might turn eight times per year while literary fiction turns twice. Allocating capital evenly means you're constantly out of romance while drowning in unsold literary hardcovers.
-
Historical turn rates by category
-
Seasonal patterns (beach reads in summer, cookbooks in fall)
-
Local market specifics (university town? Tourist destination?)
A working allocation might look like:
-
30% to fast-turning categories (romance, mystery, bestsellers)
-
25% to seasonal frontlist
-
20% to steady backlist
-
15% to local interest and events
-
10% buffer for opportunities
Track category turn rates by quarter so your allocation reflects seasonality, not just annual averages.
This isn't about perfect precision. It's about not accidentally spending your entire quarter's budget on that amazing publisher deal in week two.
The Buy Window System
Every quarter has natural buying windows that smart stores exploit. Missing these windows means paying more and getting product later.
Window 1: Pre-season (6–8 weeks before quarter) This is when you place bulk orders for predictable sellers. Publishers offer the best terms here—better discounts, free freight, extended dating. You're ordering backlist fills, series completions, and proven authors' new releases.
Window 2: Launch week (First 2 weeks of quarter) Publishers flood you with rep visits, catalogs, and "special opportunities." This is actually your adjustment window—see what's getting buzz, what early reviews look like, what other stores are betting on. Allocate 20–25% of quarterly capital here.
Window 3: Mid-quarter correction (Weeks 5–6) By now you have real sales data. Those literary debuts everyone praised? Half are already returns candidates. That sleeper romance series? You've sold through twice. This window is for doubling down on winners and admitting mistakes early.
Window 4: Next quarter setup (Weeks 10–12) While everyone else is panic-ordering for current demand, you're locking in next quarter's foundation. Publishers practically give away terms in quarter-end pushes.
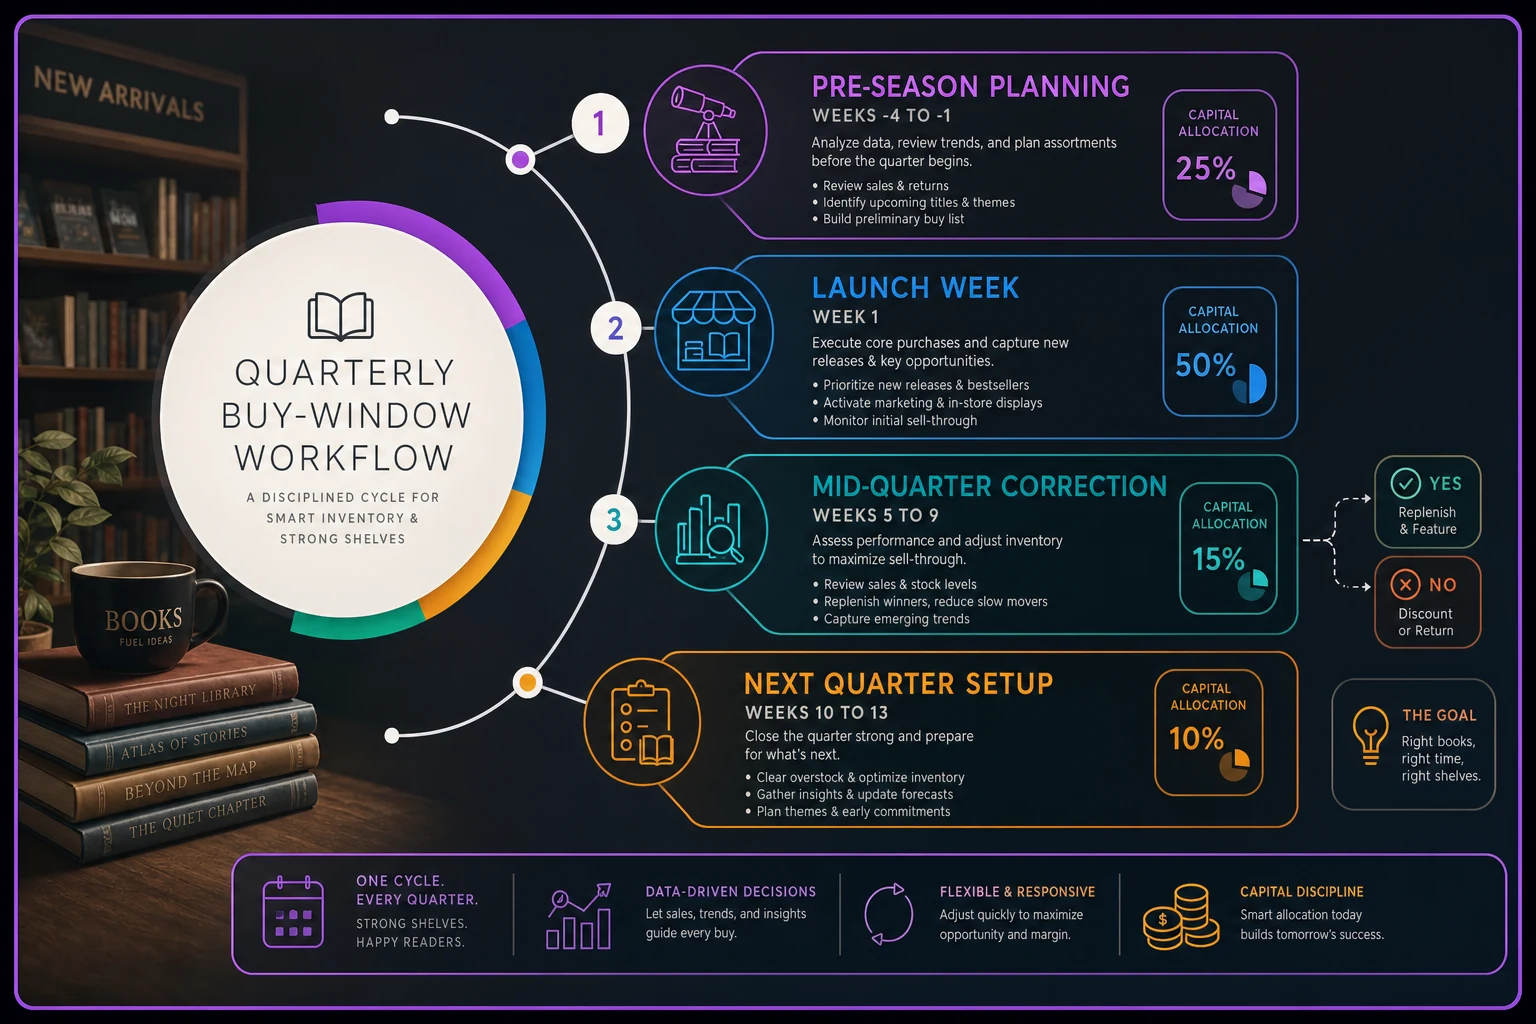
This diagram shows the windows and where to allocate capital across the quarter.
Your Ordering Spreadsheet (That Actually Gets Used)
Forget complex inventory management systems for now. You need a spreadsheet that tracks five things:
Core tracking metrics:
-
Weekly sales by category (not individual title)
-
Current on-hand value by category
-
On-order value by category
-
Historical turn rate (rolling 12 months)
-
Seasonal adjustment factor
The magic is in that last one. Track how each category performs relative to its annual average each quarter. Mystery might index at 110% in summer (beach reads) and 85% in spring. Build these patterns into your ordering.
Your model needs three sheets:
-
Historical Performance
Last 4 quarters of category-level data
-
Current Quarter Plan
Budget allocation and buy window targets
-
Order Tracker
Actual orders placed with terms and expected receipt dates
Keep it simple enough that your newest employee can update it.
Reading the Signals: When to Break Your Rhythm
Sometimes you need to break the plan. But most "emergencies" aren't.
Real reasons to break rhythm:
-
Local author with proven sales history releases unexpectedly
-
Major media event drives specific title demand (think Oprah)
-
Publisher offers 55%+ discount with extended dating
-
Competitor closes, flooding you with new customers
Fake emergencies that feel real:
-
Random customer wants obscure title "right now"
-
Publisher rep pushes "sure bestseller" mid-quarter
-
Social media buzz on debut author
-
FOMO from what other stores ordered
The hardest part is distinguishing between noise and signal. Track your "emergency" orders separately. After six months, analyze what percentage actually sold through at expected rates. Most stores find less than 20% of broken-rhythm orders justify themselves.
Working Example: Fiction Buyer's Quarterly Plan
Sarah runs a bookstore doing roughly $450K annually. Fiction represents 35% of sales, so about $40K per quarter.
Quarter Planning (March for April-June season):
| Metric | Value |
|---|---|
| Starting inventory | $18,000 on hand |
| Target inventory | $16,000 (slight reduction for summer) |
| Quarterly sales forecast | $40,000 |
| Needed purchases | $38,000 |
Capital Allocation:
-
Romance/Mystery (40%)
$15,200
-
Literary Fiction (25%)
$9,500
-
Sci-Fi/Fantasy (20%)
$7,600
-
General Fiction (15%)
$5,700
Buy Window Execution:
Pre-season (Early March): Places $22,000 order with Ingram for backlist fills and known summer releases. Gets 46% discount with 90-day dating. Focuses on series completions and book club favorites.
Launch Week (Early April): Allocates $8,000 for publisher frontlist after seeing early reviews. Splits between Random House summer debuts and smaller press literary titles. Terms average 44% with 60-day dating.
Mid-quarter (Mid-May): Reviews sales data—romance outperforming by 20%, literary underperforming by 15%. Moves $2,000 from literary budget to romance, focusing on series that are selling through.
Next Quarter Setup (June): Locks in $6,000 fall foundation order during end-of-fiscal-year publisher promotions. Gets 50% discount with September dating.
Results: Stockouts drop from 12% to 4%. Turn rate increases from 3.2 to 4.1. Cash tied up in inventory decreases by $3,000 while sales stay flat.
The Publisher Terms Game
Publishers pretend their terms are fixed. They're not. But you need quarterly volume to play the game.
-
Orders over $2,500 often qualify for free freight
-
Quarterly commitments can bump discounts 2–4%
-
Dating terms expand dramatically at quarter-end
-
Mixed orders (frontlist + backlist) get better terms than single-title orders
A store ordering $8,000 quarterly from a publisher has leverage. That same store placing twenty $400 orders has none. Consolidating orders to quarterly rhythms typically saves 6–8% on cost of goods. On $150,000 annual purchasing, that's $9,000–$12,000 straight to your bottom line.
When Systems Break: Common Failure Points
The holiday panic November hits and everything goes out the window. Suddenly you're ordering daily, chasing trends, burning cash on expedited shipping. Build November/December as its own special quarter with 40% of annual capital allocated.
The cash crisis Landlord raises rent, HVAC dies, or sales slump. That quarterly buying capital becomes operating expense coverage. This is why you need the 10% buffer—it's not really for "opportunities," it's for survival.
The new employee Your experienced buyer leaves. The new person doesn't trust the system yet, reverts to reactive ordering. Document your process, but more importantly, show them the numbers. Most people don't believe systematic buying works until they see their own stress levels drop.
The publisher ambush Major publisher changes terms, adds minimums, or shifts distribution. Your whole model breaks. Keep your allocation flexible enough that you can shift 20% between vendors without breaking the system.
Manual Today, Automated Tomorrow
Right now, this might feel like a lot of tracking. The average bookstore manager spending those 8–12 hours weekly on ordering is mostly doing duplicate work—checking the same titles, calculating the same reorder points, negotiating the same terms.
This is where modern bookstore inventory forecasting becomes transformative. Instead of manually tracking turn rates, an operational platform monitors them continuously. Instead of guessing seasonal adjustments, AI automation identifies patterns from your actual sales history. Instead of juggling multiple publisher catalogs and terms, a centralized system shows you optimal order timing and quantities.
The stores implementing AI-powered inventory management see the biggest improvements in two areas: cash liberation and stress reduction. When software handles the routine calculations and monitoring, buyers can focus on curation and customer relationships. One store in Portland cut inventory investment by 22% while increasing sales 8% simply because their automated platform caught patterns humans missed—like the poetry section that sold 3x during the university semester but died in summer.
But automation only works when built on solid processes. Stores that try to automate chaos just get faster chaos. Build your quarterly rhythm manually first. Once it's working, then consider platforms that can enhance and scale what you've built.
Beyond Books: The Ripple Effects
When quarterly buying works, it fixes more than inventory problems. Staff stress drops because they're not constantly crisis-ordering. Customer satisfaction improves because wanted titles stay in stock. Cash flow smooths out because you know exactly when big payments hit.
You get your time back. Those 200+ hours annually saved on ordering tasks? That's where bookstores build their actual competitive advantage—events, community partnerships, staff knowledge, customer relationships.
The stores thriving today didn't get there by having better book selection. Amazon wins that game every time. They got there by building better operations that free up resources for what actually matters: creating a bookstore experience that can't be replicated online.
Making the Shift
Don't flip your entire operation tomorrow. Start with one category—ideally your highest-volume section. Build the quarterly rhythm there, prove it works, then expand.
Month 1: Track current ordering patterns. Document how much time you spend, what you order, when orders arrive.
Month 2: Plan your first quarterly buy for that single category. Start simple—just batch your ordering into the four windows.
Month 3: Execute the plan, track results. Compare stockouts, turns, and time spent to your baseline.
Month 4: Adjust based on what you learned, expand to second category.
Within six months, you'll have your entire store on quarterly rhythms. Within a year, you'll wonder how you ever operated differently.
This isn't about perfection. Even a messy quarterly rhythm beats perfect reactive ordering. Because systematic buying—even imperfect systematic buying—gives you something precious: predictability. And in retail, predictability is profit.
Ready to elevate your bookstore’s operations?
Join 500+ bookstores using Bookstorely to boost sales, optimize stock, and delight book lovers.