



Most bookstore forecasting advice assumes you have years of clean sales history, a category manager, and enough volume that the law of averages smooths out the noise. Indie stores have none of that. You might sell three copies of a backlist title in six months, then move nine in two weeks because a book club picked it. Your "data" is thin, spiky, and full of one-off events that never repeat the same way twice.
That's the actual problem. Not that you can't forecast — but that standard tools assume a signal you don't have. What you need instead is a set of small, defensible rules that turn thin data into reorder decisions you can trust, and a way to know quickly when a rule is wrong before it eats your cash.
This is a working framework: velocity windows sized for low volume, event-adjusted ramps, lead-time math tied directly to reorder triggers, and the safety-stock and handoff rules that keep the whole thing from falling apart when the person doing the buying is also the person running the register. Everything here is built to live in a spreadsheet you can maintain in an hour a week.
Why forecasting breaks at bookstore scale
Chain forecasting works because volume creates stability. When a store sells 400 units of a title a week, a bad week barely moves the average. When you sell four, one book club or one broken display can swing your "velocity" by 50% and your formula happily reorders based on the swing.
-
The single-copy problem. Half your catalog probably sells zero to two copies a month. Traditional velocity math treats a jump from 0 to 2 as infinite growth. Reorder off that and you've got dead stock.
-
The event echo. A signing moves 40 copies of one title in a night. If your window includes that night, the title looks like a runaway hit for weeks afterward and you overbuy.
-
The lead-time blind spot. A title takes 3 days from one distributor and 18 from another. If your reorder point ignores which source, you either stock out waiting or you trigger too early and tie up cash.
-
The handoff gap. The forecast says reorder, but the person who reads that signal isn't the person placing the PO, and the note gets lost between a busy Saturday and Monday's distributor cutoff.
Forecasting doesn't fail because the math is hard. It fails because thin data plus loose handoffs turns every rule into a guess. The fix is to make the rules boring, explicit, and testable.
Velocity windows: the core recipe
Velocity is just units sold per unit of time, but the window you choose is everything. Too short and one book club wrecks it. Too long and you're forecasting off books that stopped selling months ago.
Never miss a sale or stock shortage again.
Bookstorely helps you manage inventory, orders, and customer relationships seamlessly.
- Integrated inventory tracking
- Customer purchase history
- Sales reporting & analytics
No credit card required
For indie volume, a blended two-window approach works better than any single number. You calculate two velocities and let the slower one act as a brake.
Window A — recent signal (4 weeks): catches genuine momentum. Window B — stable signal (12 weeks): anchors against noise. Then you take a weighted blend that leans on the stable window unless recent sales are dramatically higher and sustained.
Here's the no-code formula, written for a spreadsheet where each row is a title:
``
Velocity4wk  = SUM(units last 28 days) / 4
Velocity12wk = SUM(units last 84 days) / 12
BlendedWeekly = (Velocity4wk  0.4) + (Velocity_12wk  0.6)
``
The 40/60 weighting is deliberate. It keeps a single hot week from dominating. If you want the store to react faster to trends, shift toward 50/50 — but never let the recent window carry more than 60%, or you'll chase every spike.
One rule that saves you from the single-copy trap: if Velocity_12wk is below 0.25 (roughly one copy per month), don't let the blended number trigger an automatic reorder at all. Flag it for a human eyeball instead. Slow titles should never auto-reorder off a random blip.
| Title | Units (28d) | Units (84d) | Vel 4wk | Vel 12wk | Blended weekly | Auto-reorder eligible? |
|---|---|---|---|---|---|---|
| Bestseller A | 20 | 54 | 5.0 | 4.5 | 4.7 | Yes |
| Midlist B | 6 | 15 | 1.5 | 1.25 | 1.35 | Yes |
| Backlist C | 2 | 3 | 0.5 | 0.25 | 0.35 | No — flag for review |
| Event spike D | 41 | 44 | 10.25 | 3.67 | 6.3 | Yes, but see event rule |
Notice title D. The 84-day window already dampens the spike, but it's still overstated because the event sales are sitting inside both windows. That's what the next section fixes.
Event-adjusted ramps: stripping out sales that won't repeat
An event sells books in a way that has nothing to do with baseline demand. A launch night, an author visit, a school bulk order, a viral moment — these inflate velocity and, if left in, cause you to reorder into demand that already evaporated.
The rule is simple to state and easy to skip: event sales get tagged and removed from the velocity baseline, then added back as a separate one-time ramp when you expect them to recur.
-
Tag every sale line that came from a known event — signing, class set, book-club bulk, marketplace surge. Most POS systems let you add a transaction note or a channel tag. If yours doesn't, a separate "event units" column you fill in weekly works fine.
-
When you compute velocity, subtract tagged units from the window totals so baseline reflects normal walk-in and web demand.
-
For events you know are coming again (a monthly book club, a recurring class order), build a small ramp add-on — the expected event quantity — and add it on top of baseline only for the reorder that covers that date.
Reworking title D from above: if 38 of those 44 units in 84 days were a one-time launch, baseline velocity is (44 - 38) / 12 = 0.5/week, not 3.67. That's the difference between reordering a dozen copies you'll be marking down in the spring and reordering the two you'll actually sell.
The mistake most stores make here isn't failing to tag events — it's tagging them and then never removing them from the baseline math. Tags are useless if the velocity formula still counts them. Wire the subtraction in once and it runs itself.
Lead-time adjustments and the reorder point
Once you have a clean baseline velocity, the reorder point is where forecasting meets the calendar. This is the number that says order now — and it has to account for how long the book actually takes to arrive, because demand doesn't pause while you wait.
The core reorder-point formula:
``
LeadTimeDemand = BlendedWeekly * (LeadTimeDays / 7)
ReorderPoint     = LeadTimeDemand + Safety_Stock
``
Lead time is per-source, not per-store. A wholesaler shipping in 2–3 days and a small press shipping in 3 weeks produce wildly different reorder points for the same velocity. Keep a lead-time value on each supplier and pull it into the title row based on your preferred source.
Say a midlist title sells 1.35/week and your main wholesaler runs 4 business days (call it 6 calendar days, padded):
``
LeadTimeDemand = 1.35 (6 / 7) = ~1.16 units
`
So you need to trigger a reorder before you drop below roughly one copy plus safety stock. For a title that sources from a slow small press at 21 days:
`
LeadTimeDemand = 1.35 (21 / 7) = ~4.05 units
``
Same book, same velocity, but the slow source means you reorder when you still have four-plus copies on the shelf. Miss that distinction and slow-source titles are the ones that quietly stock out over and over while you wonder why a steady seller keeps disappearing.
A practical padding rule: add 1–2 calendar days to every supplier's stated lead time. Stated lead times are best-case. Cutoffs, weekends, and backorders are the norm, not the exception.
Safety-stock math without pretending you have clean data
Textbook safety stock uses demand standard deviation and a service-level Z-score. With bookstore volume, your standard deviation is mostly noise, so a full statistical model gives you false precision. A simpler tiered approach holds up better and is far easier to maintain.
| Tier | What belongs here | Safety stock rule |
|---|---|---|
| A — core/reliable | Steady sellers, staff picks, section anchors | 50% of lead-time demand, min 2 copies |
| B — normal | Most midlist and backlist that moves | 30% of lead-time demand, min 1 copy |
| C — slow/uncertain | Long tail, unpredictable, special interest | No safety stock — reorder only on confirmed demand |
Applied to the midlist example (lead-time demand ~1.16 at Tier B): safety stock = max(1, 0.3 * 1.16) = 1 copy. Reorder point = 1.16 + 1 = 2.16, round up to 3. When on-hand-plus-on-order hits 3, you reorder.
A tier assignment review every quarter, alongside a quick ISBN audit, is how you keep the inputs honest.
The key insight: safety stock is a business decision disguised as math. A section-anchor title you never want to be caught without earns more buffer. A speculative one-copy gamble earns none. Don't let a formula make that judgment for you — let the tier assignment make it, and let the formula do the arithmetic.
Assigning tiers is also where your catalog hygiene pays off. If your ISBNs are a mess and editions are duplicated, your velocity is spread across phantom records and every number here is wrong. Getting the underlying data clean before you trust any of this is worth doing — the groundwork in a proper data governance and analytics roadmap is what makes forecasting math meaningful instead of decorative.
Tying it together: the reorder trigger and the buyer handoff
A trigger nobody acts on is just a number in a cell. The forecast has to produce a clean handoff to whoever places the order, with enough context that they don't have to re-verify everything.
-
Compute on-hand position
Available = OnHand + OnOrder - Committed(committed = preorders, holds, pending web orders). -
Compare to reorder point if
Available <= Reorder_Point, flag the title. -
Apply the auto-eligibility gate if Tier C or
Velocity_12wk < 0.25, route to review instead of auto-order. -
Calculate suggested order quantity enough to reach a target cover — typically 4–6 weeks of blended velocity plus safety stock, minus current available. Respect supplier case-pack minimums.
-
Attach the context the buyer needs source, lead time, last order date, event flags, and whether any recurring event ramp applies to this cycle.
The suggested-quantity formula:
``
TargetCoverUnits = BlendedWeekly * CoverWeeks + SafetyStock
SuggestedOrder     = TargetCoverUnits - Available
(round up to case pack; never below supplier minimum)
``
A sample reorder-trigger template
| Field | Example value |
|---|---|
| Title / ISBN | Book Title / 9780000000001 |
| Available (on-hand + on-order − committed) | 2 |
| Blended weekly velocity | 1.35 |
| Baseline excludes events? | Yes |
| Tier | B |
| Reorder point | 3 |
| Preferred source | Wholesaler X |
| Lead time (padded) | 6 days |
| Target cover | 5 weeks |
| Suggested order qty | 5 (rounded to case) |
| Recurring event ramp? | None this cycle |
| Status | Trigger — ready to order |
The handoff rule that matters most: the person reading the trigger and the person placing the PO need one shared queue, not a verbal relay. In a lot of small stores the forecasting lives in one person's head and the ordering happens whenever there's a spare ten minutes. That gap is where triggers die. A simple shared sheet with a "status" column — trigger / ordered / received — beats any amount of clever math done in isolation, because it makes the pending decision visible to everyone on shift.
Here's a simple diagram of the workflow from trigger to order — it shows who touches the row and what status changes happen at each step.
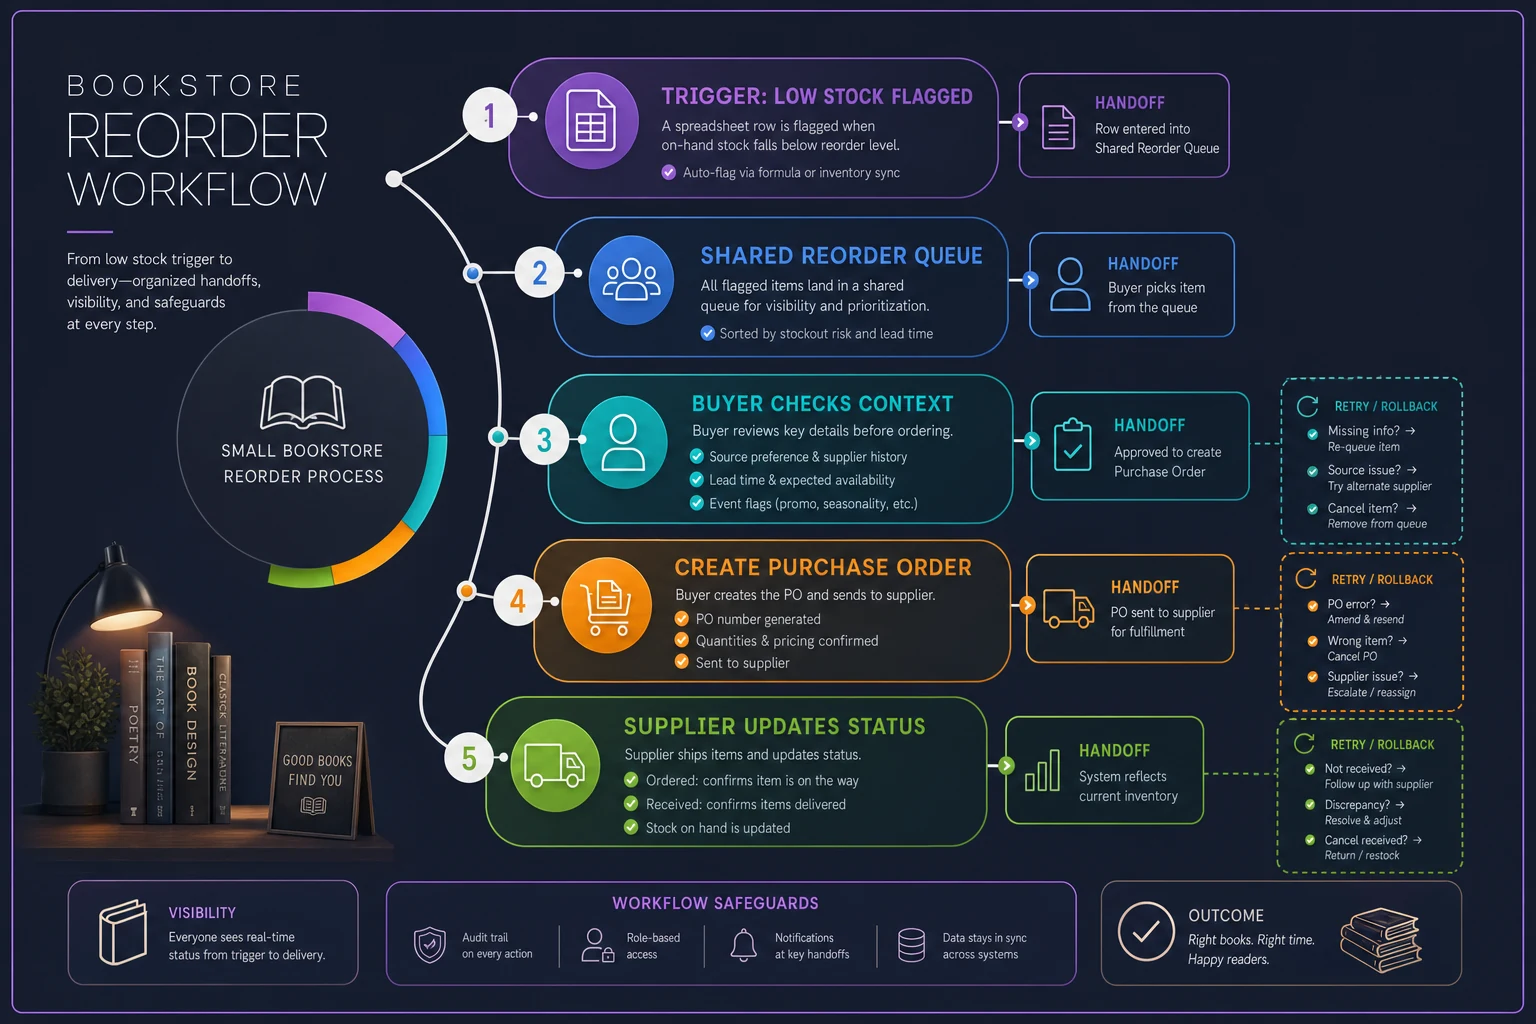
Weekly reorder triggers keep steady sellers in stock. But a proper quarterly buying rhythm is where you make the bigger bets on new titles and seasonal swings that have no velocity history yet — that's the part the weekly triggers can't cover on their own.
Test and rollback rules: how to know a rule is wrong fast
Every parameter in this framework is a guess until your store proves it. The stores that get burned are the ones that set a formula and never check whether it's actually working. Build in a review loop from day one.
Run the framework in suggest-only mode for the first 4–6 weeks. It produces triggers, but a human approves every order. You're comparing what the formula wanted against what a sensible buyer would actually do.
-
False triggers titles the formula flagged that you decided not to order. High false-trigger rate usually means your recent window is weighted too heavy or you're not stripping events.
-
Missed stockouts titles that went to zero without triggering in time. Usually a lead-time value that's too optimistic or a safety-stock tier set too low.
-
Overstock creep titles where suggested quantities keep outrunning actual sell-through. Usually cover-weeks set too high or slow titles sneaking past the eligibility gate.
Rollback rules — pick these before you need them:
-
If false triggers exceed roughly 1 in 4 flagged titles in a week, drop the recent-window weight (e.g., 40% → 30%) and re-run.
-
If you hit more than a couple of surprise stockouts on Tier A/B titles, add a calendar day to the offending supplier's lead time before touching anything else.
-
If a whole category is over-ordering, cut its cover-weeks by one before adjusting velocity math.
-
Change one parameter at a time, and let it run at least two weeks before judging it. Changing three things at once means you'll never know which one helped.
The discipline here is the whole point. Thin-data forecasting isn't about getting the formula perfect on the first try — it's about having a tight enough feedback loop that a wrong rule costs you two weeks of over-ordering instead of a season of dead stock. Suggest-only mode feels slow when you're used to just placing orders, but those first few weeks of comparison data are genuinely how you find out where the formula doesn't match how your store actually sells.
When this framework makes sense — and when it doesn't
When it's a good fit: you carry a few thousand active titles, you're getting surprised by stockouts on steady sellers, and your buying is currently vibes-based or done entirely from memory. This gives you defensible triggers without pretending you're a chain.
When it's overkill: if you carry a tight curated list of a few hundred titles and you personally know every book's rhythm, a formal velocity model adds overhead you don't need. A simple min/max per title on a sheet will serve you better. Forecasting infrastructure has a cost, and below a certain catalog size that cost outruns the benefit.
Who should not automate the triggers: if your catalog data is dirty — duplicate ISBNs, split editions, phantom records — do not turn on auto-ordering. Garbage velocity produces confident, wrong reorders, and you'll lose more to bad automation than you ever lost to manual guessing. Clean the catalog first, run suggest-only, then consider automating.
A real scenario
A two-person neighborhood store carrying roughly 4,000 active titles kept running out of about a dozen reliable backlist sellers while sitting on shelves of event leftovers they'd overbought after signings. Their buying happened Sunday nights from memory, and the same three titles kept slipping through.
They built the two-window velocity sheet, tagged the previous quarter's event sales out of the baseline, and set per-supplier lead times — which surfaced that their favorite small press was actually running closer to three weeks, not the one week they'd assumed. Everything ran suggest-only for about five weeks.
The changes weren't dramatic on paper, and that's kind of the point. Surprise stockouts on their core sellers dropped from a handful a month to nearly none. Event-title overbuying — the stuff that used to hit the markdown table by spring — fell off noticeably once the ramp logic separated one-time launches from real demand. Cash that had been sitting in dead event stock freed up for actual buying. No revenue miracle, just fewer holes on the shelf and less money frozen in books that were never going to move.
The takeaway
Indie forecasting isn't a smaller version of chain forecasting — it's a different job. You're not smoothing large numbers; you're making careful decisions from thin, spiky signals and refusing to let a single week fool you. Blended velocity windows keep the noise down, event tagging keeps one-time spikes out of your baseline, per-source lead times make your reorder points honest, and tiered safety stock puts the business judgment back where it belongs.
The math matters less than the loop around it: clean data underneath, a shared queue so triggers actually reach the buyer, and rollback rules so a wrong parameter costs you two weeks instead of a season. Start in suggest-only mode, change one thing at a time, and let the store's own numbers tell you where the rules are wrong. That's how thin data turns into reorder decisions you can actually stand behind.
Ready to elevate your bookstore’s operations?
Join 500+ bookstores using Bookstorely to boost sales, optimize stock, and delight book lovers.