



Most bookstore merchandising meetings fall apart in the first ten minutes because nobody agrees on the numbers. The buyer pulls sell-through from the POS, the store manager eyeballs the floor, the accountant quotes a margin figure calculated on a different cost method, and consignment titles get argued about separately because they live in a spreadsheet somebody forgot to update. By the time everyone reconciles their versions, the hour is gone and the only decision made is "let's revisit next week."
This post fixes one narrow thing: the weekly merchandising meeting. Not forecasting, not annual planning, not the full analytics stack. Just the single dashboard your team looks at every Monday, the twelve reports it should be able to spit out on demand, and the export schemas that make those reports portable, auditable, and consistent across new, used, remainder, and consignment stock.
If you've already set up category-percentage planograms and a 4-week display ROI test, this dashboard is the measurement layer that sits on top of it. Every number in the room comes from the same place, computed the same way, with a clear path back to the underlying transaction.
The one dashboard, laid out for a 45-minute meeting
A merchandising dashboard that tries to show everything shows nothing. The version that actually works is built to be read top-to-bottom in the order a meeting flows: How did last week go → what's winning → what's stuck → what needs a decision today.
Here's the layout that holds up across most indie shops:
Row 1 — KPI cards (the week in six numbers). Net sales, units sold, blended margin %, sell-through %, days of supply, and return rate. Each card shows the current week, the week-over-week delta, and a tiny sparkline for the last 8 weeks. The delta matters more than the absolute number — a 61% margin means nothing until you see it dropped four points from last week. Row 2 — Week-over-week bar charts. Two side-by-side: net sales by category, and units by channel (in-store, web, events, marketplace). Seasonal shifts and a sluggish web channel announce themselves here before anyone has to ask. Row 3 — Pareto + heatmap. A Pareto chart showing which 20% of SKUs drive roughly 80% of margin dollars — not revenue, margin — and a day-of-week × category heatmap so you can see that YA sells on weekends while business books only move Tuesday through Thursday. The Pareto is the most ignored and most useful chart on this board. Row 4 — Margin waterfall. Start at gross sales, subtract discounts, markdowns, refunds, and COGS, land on margin dollars. On a mixed-inventory floor this waterfall should be filterable by condition so you can see that your used section is carrying the real margin while new frontlist barely breaks even after returns. Row 5 — Action table. The part people skip and shouldn't. A sortable table of exceptions flagged that week — low-margin SKUs, aging stock, PO delays, high returns — each with an inline action button. This is where the meeting produces output instead of commentary.
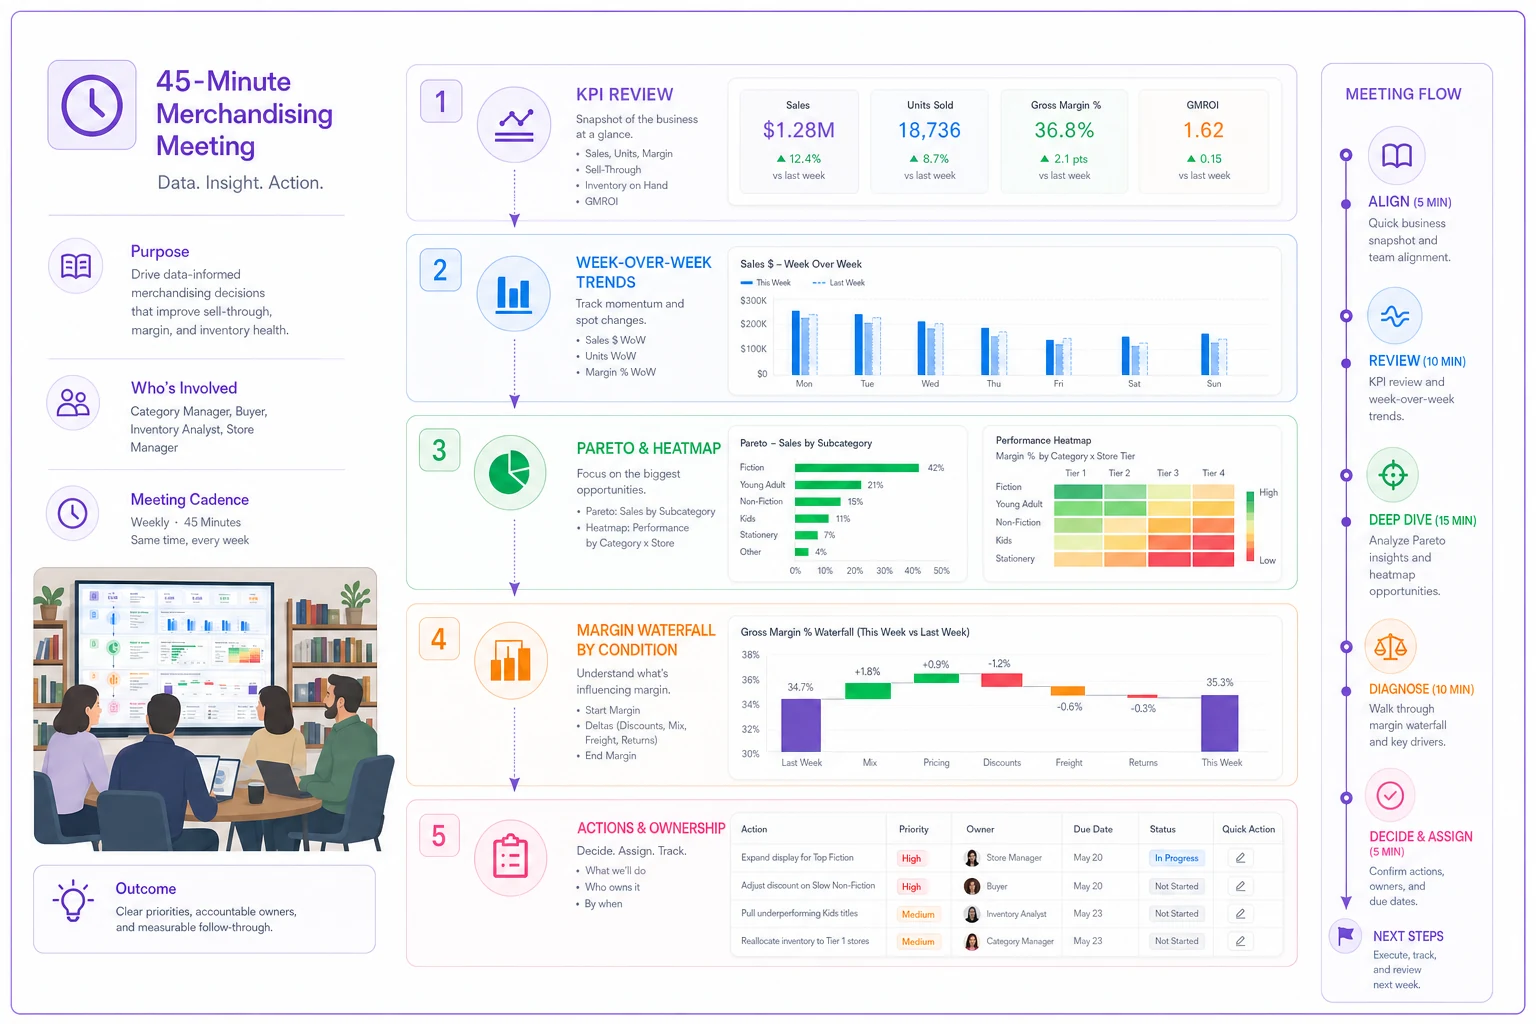
One layout note worth keeping: rows 1 and 2 should be visible without scrolling. If your team has to scroll to find out whether the week was good, they'll skip it and ask out loud, and you're back to arguing over versions.
The twelve prebuilt reports, mapped to how the meeting actually uses them
The dashboard is the summary view. Behind it sit twelve reports your team pulls when the summary raises a question. Each one maps to a specific moment in a merchandising conversation, ordered here by how often they actually come up.
Never miss a sale or stock shortage again.
Bookstorely helps you manage inventory, orders, and customer relationships seamlessly.
- Integrated inventory tracking
- Customer purchase history
- Sales reporting & analytics
No credit card required
| # | Report | Meeting use case | Key metrics | Core filters |
|---|---|---|---|---|
| 1 | Weekly Merchandising Snapshot | Open the meeting | netsales, units, margin%, sellthrough%, WoW deltas | date range, store/channel |
| 2 | Top Sellers by Margin | What to reorder / feature | margin$, margin%, units, sell_through% | date, BISAC/genre, condition |
| 3 | Top Sellers by Units | Floor traffic & display hits | unitssold, netsales, daysofsupply | date, display code, channel |
| 4 | Category Profitability | Planogram allocation | margin$ per category, margin%, sq-ft contribution | date, BISAC, store |
| 5 | Slow Movers / Aging Inventory | Markdown candidates | daysofsupply, age bucket, sell_through% | age band, category, condition |
| 6 | Markdown & Promotion Impact | Did the promo pay? | pre/post units, discount$, margin$ net of markdown | date, display code, promo tag |
| 7 | Vendor/Publisher Performance | Buying & terms review | margin% by vendor, return rate, fill rate | vendor, date, consignment flag |
| 8 | PO vs Received | Delivery risk / gaps | orderedqty, receivedqty, variance, lead time | vendor, PO date, status |
| 9 | Inventory Variance / Shrinkage | Count integrity | expected vs counted, variance$, variance% | store, category, count date |
| 10 | Consignment Accounting | Owner payouts & recognition | units sold, split%, owner payable, store margin | consignment_owner, date |
| 11 | Display Test Results | Keep/revert display calls | paired lift, margin lift, units lift | display code, test window |
| 12 | Returns & Refunds Analysis | Quality & vendor flags | refund$, return rate, reason codes | vendor, category, date |
Reports 2 and 3 look redundant but aren't. Top-by-units is what your staff notices on the floor; top-by-margin is what keeps the lights on. The books that sell the most copies and the books that make the most money overlap by maybe half in a typical shop. Running only one of them is how stores end up over-featuring a hot $14 paperback at 30% margin while quietly ignoring a steady-selling $40 art book doing twice the margin dollars.
Export schemas: the columns that make reports portable and auditable
Every report should export to CSV, XLSX, and PDF — CSV for anyone doing their own analysis, XLSX for the accountant who wants formulas intact, PDF for whoever prints something to bring to the meeting. The schema below is the backbone. Standardizing on these exact column names across all reports is what prevents the "my spreadsheet says something different" problem, because every downstream file maps back to identical fields.
| Core CSV column set (SKU-level reports) |
|---|
| sku_isbn |
| title |
| author |
| vendor |
| units_sold |
| net_sales |
| gross_sales |
| discounts |
| refunds |
| cogs |
| margin_dollars |
| margin_pct |
| starting_inventory |
| received_qty |
| ending_inventory |
| sellthroughpct |
| daysofsupply |
| condition |
| consignment_owner |
| consignment_split |
Standardize the exact column names in your import transforms before you start importing different POS/IMS exports.
A few field definitions that consistently trip people up:
-
- netsales = grosssales − discounts − refunds. Define it once and never let a report deviate. Half of all "the margin number is wrong" arguments trace back to two reports disagreeing on whether refunds are already netted out.
-
- marginpct should be computed on netsales, not gross. State the denominator in the export footer so nobody has to guess.
-
- sellthroughpct = unitssold ÷ (startinginventory + received_qty). Pick this formula and lock it.
-
- daysofsupply = ending_inventory ÷ average daily units over the trailing window. Note the window length in the file.
-
- condition carries
new / used / remainder / consignment— this single field is what lets every report filter mixed inventory without a separate export. -
- consignment_split is the store's share as a decimal (0.40 = store keeps 40%). Keep it store-side consistently so payouts never get computed backwards.
For the consignment report specifically, add ownerpayable (unitssold × unitprice × (1 − consignmentsplit)) and recognition_date so revenue recognition and owner liability land in the same row. Mixing consignment margin into blended store margin without this split field is the most common way shops overstate profitability — you're booking revenue on inventory you never owned.
Delivery: scheduled digests, APIs, and who gets what
Pull-based dashboards get ignored on busy weeks. The fix is push.
-
Scheduled email digest — a Monday 7am PDF of the Weekly Merchandising Snapshot plus the action table, so the meeting starts with everyone having already seen it.
-
CSV/XLSX auto-drop — the accountant gets the Consignment Accounting and Vendor Performance exports dropped into a shared folder monthly, no request needed.
-
API/webhook endpoints — for shops syncing to accounting or a BI tool. A webhook that fires when a PO is marked received, or when a variance exceeds a threshold, lets downstream systems react without polling. Keep the payload to the core schema above so you're not maintaining five different field formats.
Most indie shops need the email digest and the folder drop. The API matters only once you have a second system that genuinely needs the feed. Don't over-engineer it before you're there.
Alerts and exception workflows: turning the meeting into decisions
An alert is only useful if it arrives with a recommended action and somewhere to take it. Scattered alerts — an email here, a POS flag there — just add noise. They should all surface in one place: the dashboard's action table, and the top of the Monday digest.
Recommended alert types, with default triggers you can tune:
-
Low margin — any featured SKU under your margin floor (e.g. below 35% net) for two consecutive weeks.
-
Low sell-through — new-release SKU below roughly 15% sell-through at the 4-week mark.
-
High aging — stock crossing an age band (90 / 180 / 365 days) with daysofsupply above a ceiling.
-
PO delays — any PO past expected-receive date with variance between ordered and received quantities.
-
High return rate — SKU or vendor return rate above roughly 8% over a rolling window.
Each alert row in the action table should carry an inline quick action, so whoever's running the meeting can resolve it without opening four other systems:
-
Low sell-through / high aging → Schedule markdown or Tag for display (give it one more shot in a better spot).
-
Low margin → Flag for buyer review or Create PO note for the next terms conversation.
-
PO delay → Open PO / Email vendor with the variance pre-filled.
-
High return rate → Mark for return to vendor, or Flag vendor in the performance report.
The discipline that makes this work: every alert that surfaces must be dispositioned in the meeting — actioned, snoozed with a date, or dismissed with a reason. Alerts that sit untouched week after week train everyone to ignore the whole table.
Roles, permissions, and inline quick actions
A four-person shop doesn't need enterprise access control, but it does need to stop the accountant from accidentally editing a cost method and floor staff from rewriting POs. A light role model handles it:
| Role | Can view | Can do |
|---|---|---|
| Merchandiser | All reports | Tag for display, schedule markdown, create display test |
| Store Manager | All reports | All merchandiser actions + approve markdowns, mark for return |
| Buyer | Vendor, PO, sell-through reports | Create PO, edit PO, set reorder flags |
| Accountant | Margin, consignment, variance reports | Toggle cost method, export financials, adjust recognition dates |
The quick actions — create PO, tag for display, schedule markdown, mark for return — should live right on the row that triggered them. The whole point is to collapse "notice a problem" and "act on it" into one click, so decisions don't leak out of the meeting into a to-do list that never gets done.
Auditability and data-quality checks
A dashboard people don't trust is a dashboard people override with gut feeling. Four controls close that gap:
-
Show formulas — click any KPI and see the exact calculation and window. This ends the margin-denominator argument permanently.
-
Change history — who adjusted a cost, who dismissed an alert, when. Essential once more than one person touches the data.
-
Cost-method toggle — switch between average cost and FIFO/last-cost and watch margin recompute. Used and remainder stock especially behave very differently under different methods, and your accountant will want to see both.
-
Row-level drillthrough — click any SKU's margin and land on the underlying transactions and the PO it came in on. This is what turns "that number looks wrong" into a 30-second check instead of a 30-minute hunt.
Three reconciliation checks should also run automatically and flag mismatches:
-
PO vs Received — ordered quantities and costs vs what actually landed. Catches short-ships and price changes before they quietly distort margin.
-
Inventory Variance — expected on-hand vs counted, tied to your cycle-count program. Feeds the shrinkage report.
-
COGS vs AP — the COGS in your margin reports vs what accounts payable shows you actually owe vendors. When these drift apart, either your cost data or your received quantities are wrong, and you want to know which before monthly close, not during it.
These checks are boring to set up and genuinely useful once they're running. The alternative is finding the discrepancy six weeks later when it's harder to unwind.
Handling mixed inventory without corrupting your margin numbers
This is where generic retail dashboards break for bookstores. A floor mixing new, used, remainder, and consignment can't be summarized with one blended margin line, because each type behaves differently:
-
New carries returnability — refunds and returns-to-vendor meaningfully affect realized margin. Report it net of returns.
-
Used typically has no vendor return path and higher margin, but variable cost. Average cost vs actual-cost matters here more than anywhere else.
-
Remainder is bought deep-discounted and non-returnable — great margin, but aging risk is real since you can't send it back.
-
Consignment is the trap
you never owned it, so it must never flow into COGS or inventory valuation the same way owned stock does. Only the store's split counts as margin; the rest is a payable.
The condition field in the core schema is what keeps these separated. Every report should default to the blended view but let you filter to a single type in one click.
[Incoming Stock] | ├── New ──────────────── Net of returns → COGS → Margin ├── Used ─────────────── Actual/avg cost → COGS → Margin ├── Remainder ────────── Deep-discount cost → COGS → Margin (aging risk) └── Consignment ──────── Store split only → Margin | Owner portion → Payable
The margin waterfall broken out by condition is usually the single most clarifying view in the whole dashboard. It's common for a shop to discover that used and remainder quietly carry the store while new frontlist runs near break-even once returns are counted. Keeping these lanes separate in both the schema and the waterfall chart is the difference between a margin number you can act on and one you have to explain away every week.
POS/IMS integration notes to prevent format mismatch
The most common integration failure isn't technical — it's column naming and units. A few mapping notes for the systems indie shops actually run:
-
Square — exports item-level sales cleanly but splits discounts and refunds into separate transaction rows. Map Square's
grosssales/netsalescarefully and net refunds yourself; don't assume its "net" matches your definition. SKU often rides in a custom field rather than a dedicated ISBN column. -
Lightspeed (Retail) — richer inventory fields; its cost field may be average or last-cost depending on setup, so confirm before trusting margin. Map Lightspeed's category to BISAC/genre deliberately — the default category tree won't match yours.
-
BookManager — strong on ISBN and publisher data, which is exactly what vendor and category reports need. Its on-hand and on-order fields map almost directly to startinginventory / receivedqty, but watch how it treats consignment and used copies — those often need a condition flag added on import.
A practical rule: write one transform that maps each system's export into the core CSV schema above, and import that, not the raw vendor file. When you change POS or add a channel, you rewrite one transform instead of every downstream report.
A short real scenario
A two-location shop running mostly new frontlist with a growing used section kept reporting a blended margin around 42% and couldn't figure out why cash was always tight. Everyone trusted the single margin number on the old spreadsheet.
Once the margin waterfall was broken out by condition, the picture shifted. New frontlist, after discounts and vendor returns, was landing closer to 28–31% — thinner than anyone believed. Used was running roughly 58–62%. And consignment had been quietly inflating the blended figure because the full sale price, not just the store's roughly 40% split, was being counted as revenue.
Nothing changed overnight. But the next two buying cycles adjusted — a bit less speculative frontlist, more weight behind used intake and the consignment program they'd been underrunning — and the cash-tight weeks got noticeably less frequent over the following quarter. The fix wasn't a new strategy. It was finally seeing the number correctly.
Integrating with your display test and planograms (quick checklist)
If you're already running paired display tests and percentage planograms, wire this dashboard into them without rebuilding either:
-
- [ ] Add a display_code field to the core schema so sales roll up to the display, not just the SKU.
-
- [ ] Point the Display Test Results report at your paired test windows so lift is calculated automatically.
-
- [ ] Feed Category Profitability margin-dollars-per-category back into your planogram percentages, so shelf space follows margin, not habit.
-
- [ ] Set the aging alert to flag planogram slots carrying stock past their age band — a full display of slow stock is a space problem, not just a markdown one.
-
- [ ] Keep the test methodology where it already lives — the merchandising system with category-percentage planograms and the 4-week display ROI test — and let this dashboard be the measurement and reporting layer on top.
The aim here is modest and specific: one dashboard, twelve reports, one agreed set of column definitions, and alerts that turn into actions inside the same room where the problem surfaced.
The aim here is modest and specific: one dashboard, twelve reports, one agreed set of column definitions, and alerts that turn into actions inside the same room where the problem surfaced. A merchandising meeting shouldn't be a debate about whose numbers are right. Settle the schema once, drill through to the transactions when anyone doubts a figure, keep mixed inventory honestly separated by condition, and the meeting shifts from reconciling spreadsheets to actually deciding what goes on the floor next week.
Ready to elevate your bookstore’s operations?
Join 500+ bookstores using Bookstorely to boost sales, optimize stock, and delight book lovers.