
Your bookstore's inventory is bleeding cash flow, and you probably don't even know which titles are doing the damage.
Walk through most indie bookstores and the pattern jumps out. Fiction shelves stuffed with hardcovers that haven't moved in months. The cookbook section where that trendy keto title from 2021 still sits eight copies deep. Meanwhile, the book everyone's asking for sold out weeks ago and you haven't reordered because daily chaos got in the way.
This isn't about being incompetent. Running a bookstore means juggling publisher catalogs, customer requests, events, online orders, and somehow tracking what's selling versus what's eating up shelf space. Most owners end up making inventory calls based on memory and whatever they noticed from yesterday's sales.
The real problem cuts deeper than excess books. When your numbers are invisible, expensive mistakes multiply. You discount titles that would have sold full price next month. You reorder bestsellers too late and lose sales. You hold dead inventory that locks up thousands in working capital.
Why bookstores drown in unusable data
Independent bookstores face something most retail doesn't – managing thousands of SKUs that change constantly, with wildly different lifecycles, seasonal patterns, and profit margins.
A clothing store might track 200 items across a few categories. Your average indie bookstore handles 8,000 to 15,000 unique titles at any moment. New releases every Tuesday. Returns to publishers with strict deadlines. Special orders that may or may not get picked up. Used books with completely different margins.
Standard POS reports weren't built for this reality. Sure, you can pull sales data. But that report won't tell you romance turns inventory every 28 days while literary fiction sits for 90. It won't flag that you've ordered the same memoir for six months straight even though nothing's sold since March.
Owners develop workarounds. Maybe you walk the store Monday mornings and eyeball what needs reordering. Keep a notebook of customer requests. Run monthly counts on specific sections.
These manual systems work until they don't. The breaking point usually hits around $400K annual revenue – enough volume that you can't hold everything mentally, but not enough margin for dedicated inventory staff.
The damage accumulates slowly. Dead inventory builds up because nobody identifies it systematically. You miss reorder points on steady sellers while chasing new releases. Seasonal opportunities slip by – nobody remembers to stock gardening books in February for the March rush.
Building a bookstore KPI dashboard that prevents problems
Most bookstore owners who attempt dashboards track vanity metrics that sound important but don't drive decisions. Total sales, customer count, average transaction value – nice to know but useless for deciding whether to return those 12 copies of last year's political tell-all.
Never miss a sale or stock shortage again.
Bookstorely helps you manage inventory, orders, and customer relationships seamlessly.
- Integrated inventory tracking
- Customer purchase history
- Sales reporting & analytics
No credit card required
The metrics that actually matter for inventory decisions are different. You need inventory velocity by category, not just overall numbers. You need to spot aging inventory before it becomes unsellable. You need early warning systems for steady sellers running low.
A functional bookstore dashboard tracks:
Inventory turnover by category – Fiction might turn 8 times annually while art books turn 3 times. That's not a problem, it's reality. But if fiction drops to 4 turns, dead weight is dragging down the section.
Days of supply remaining – For your top 100 titles, how many days of inventory do you have based on recent sales velocity? This prevents both stockouts and over-ordering.
Aging inventory alerts – Any title sitting longer than 120 days without a sale needs attention. Either it's in the wrong spot, priced wrong, or needs to go back to the publisher.
Return window warnings – Most publishers give you 90-365 days to return unsold inventory for credit. Missing these windows turns returnable inventory into permanent dead stock.
Category performance trends – Is cookbook velocity dropping? Might be seasonal, might be a layout issue, might be Amazon eating that category. You need to know.
Special order fulfillment rate – What percentage of special orders actually get picked up? Below 80% means you're tying up cash and shelf space on abandoned books.
The concrete triggers that eliminate guesswork
Raw numbers without decision rules are just decoration. Your dashboard needs specific thresholds that trigger specific actions. Otherwise you're still making gut decisions, just with fancier charts.
Take inventory aging. Here's a real decision framework:
| Age | Action | Exception |
|---|---|---|
| 60 days no sale | Move to front table or end cap | Backlist classics, local authors |
| 90 days no sale | Discount 20% | Special orders, series books waiting for next release |
| 120 days no sale | Discount 30% or return | Signed copies, books with local connection |
| 180 days no sale | Return or donate | None |
The exceptions matter as much as the rules. That signed copy from your last author event might sit for six months but still be worth holding. The third book in a series might not move until the fourth comes out. But explicit exceptions prevent everything from becoming an exception.
Reorder triggers work the same way. Instead of walking the shelves and guessing what's low:
For steady sellers (anything selling 2+ copies monthly):
-
Reorder when stock hits 2 weeks of supply
-
Order quantity
6 weeks of supply
-
Expedite if under 1 week of supply
For new releases (published within 90 days):
-
Reorder when stock hits 1 week of supply if selling 4+ per month
-
Don't reorder if velocity drops below 2 per month
-
Order quantity
3 weeks of supply
For seasonal titles:
-
Begin building stock 6 weeks before season
-
Target stock
150% of last year's seasonal sales
-
Start discounting 2 weeks before season ends
These aren't random numbers. They come from watching hundreds of bookstores either nail inventory management or slowly suffocate under unsold books. The stores that survive long-term have some version of these rules, whether written down or lived experience.
Staffing triggers most stores miss
Your KPI dashboard shouldn't just track inventory. The same data that tells you when to reorder should tell you when to adjust staffing.
Most bookstores staff based on the calendar. Tuesday for new releases, Saturday because it's always busy, extra coverage for events. But transaction patterns tell a more useful story.
Track transactions per hour by day of week. Not sales dollars, actual transaction count. You might discover Wednesday 2-5pm consistently sees 18 transactions per hour while Saturday morning only hits 12. That Wednesday rush needs two people on the floor. Saturday morning might be fine with one plus backup.
Event staffing gets more interesting. Track the ratio of event attendance to next-day sales. Some author events pack the store but generate minimal sales. Others bring 30 people who each buy three books and come back the following week. Your staffing should reflect actual revenue impact, not just head count.
The holiday surge breaks most indie bookstores because they start staffing up too late. Your dashboard should track year-over-year sales velocity starting October 1st. When velocity hits 130% of normal, add shifts. At 150%, you need dedicated gift wrap and phone order handling. At 200%, someone should manage online orders full-time or you'll lose customers to Amazon convenience.
Sample dashboard view for a typical Tuesday
Your morning check should look like this. Not 47 reports to dig through, but one screen with the numbers that drive immediate decisions:
[DASHBOARD MOCKUP - Main View]
Red Alerts (Action Required Today):
-
3 titles hitting return deadline this week
-
"Lessons in Chemistry" down to 2 copies (sells 3/week)
-
Romance section turnover dropped 40% month-over-month
Yellow Warnings (Action This Week):
-
18 titles aged 90-120 days without movement
-
Kids section at 45 days inventory (target
30 days)
-
Special order pickup rate at 72% (target
80%)
Green Metrics (On Track):
-
Fiction turnover
7.2x annually
-
Staff productivity
14 transactions/hour
-
Return rate
8% (industry average: 12%)
Today's Decisions:
-
Process returns for
[List of 3 titles with quantities]
-
Reorder urgent
[List with suggested quantities]
-
Titles to discount
[List with recommended discount %]
-
Section requiring floor move
Romance (suggest end cap promotion)
This replaces the morning walk-through, the inventory guessing game, the "what should we put on sale?" conversation. Every decision has data behind it, but more importantly, you only see decisions that need to be made right now.
When blind discounting destroys margins
Discounting feels like problem-solving. Books aren't moving, slash the price, clear the shelf. Except most bookstore discounting is reactive panic, not strategic inventory management.
Usually it goes like this: You notice a stack of hardcovers sitting for "a while." Maybe that celebrity autobiography or the buzzed-about novel that never took off. You slap 30% off stickers on them and hope they move.
But you just created three problems. First, you might have discounted something that would sell at full price in two weeks when the author appears on a podcast. Second, you trained customers to wait for discounts instead of buying new releases. Third, you've got no data on whether 30% was the right number or if 20% would have worked.
Strategic discounting means testing and measuring. Start with 20% on titles aged 60-90 days. Track the velocity lift. If a 20% discount doubles velocity, you've found your sweet spot. If it barely moves the needle, those titles need to go back to the publisher, not deeper discounts.
Category matters too. Fiction readers are price-sensitive and will snap up discounted paperbacks. Art book buyers barely notice a 20% discount but might bite at 40%. Cookbooks move best at 25% off because that hits a psychological price point around $19.99 for a $26.95 book.
Your dashboard should track discount effectiveness:
-
Velocity lift per 10% discount increment
-
Margin impact of discounting versus returning
-
Customer basket size when discounted items are included
-
Time to clear at different discount levels
Most stores discover they're discounting too much, too late. Better to catch inventory problems at 60 days with a small discount than panic at 120 days with deep cuts that kill margins.
The workflow that keeps operations smooth
Numbers and triggers are useless without a workflow that makes them actionable. The best dashboard won't help if you check it once a month when you remember.
Daily (5 minutes at opening): Check red alerts only. Process returns hitting deadline. Place urgent reorders. That's it. Don't get sucked into analysis.
Weekly (30 minutes, typically Monday): Review yellow warnings. Pick which aged inventory to discount or move. Adjust next week's staff schedule based on projected traffic. Review special order aging.
Monthly (2 hours): Deep dive on category performance. Identify trending sections to expand and dying sections to shrink. Review seasonal planning for next 60 days. Analyze discount effectiveness and adjust strategy.
The key is making the daily check automatic. If you have to remember to look at the dashboard, it won't happen consistently. Some stores set up automated morning emails with just the red alerts. Others make it part of the opening checklist, right after turning off the alarm.
Here's a quick visual of the workflow.
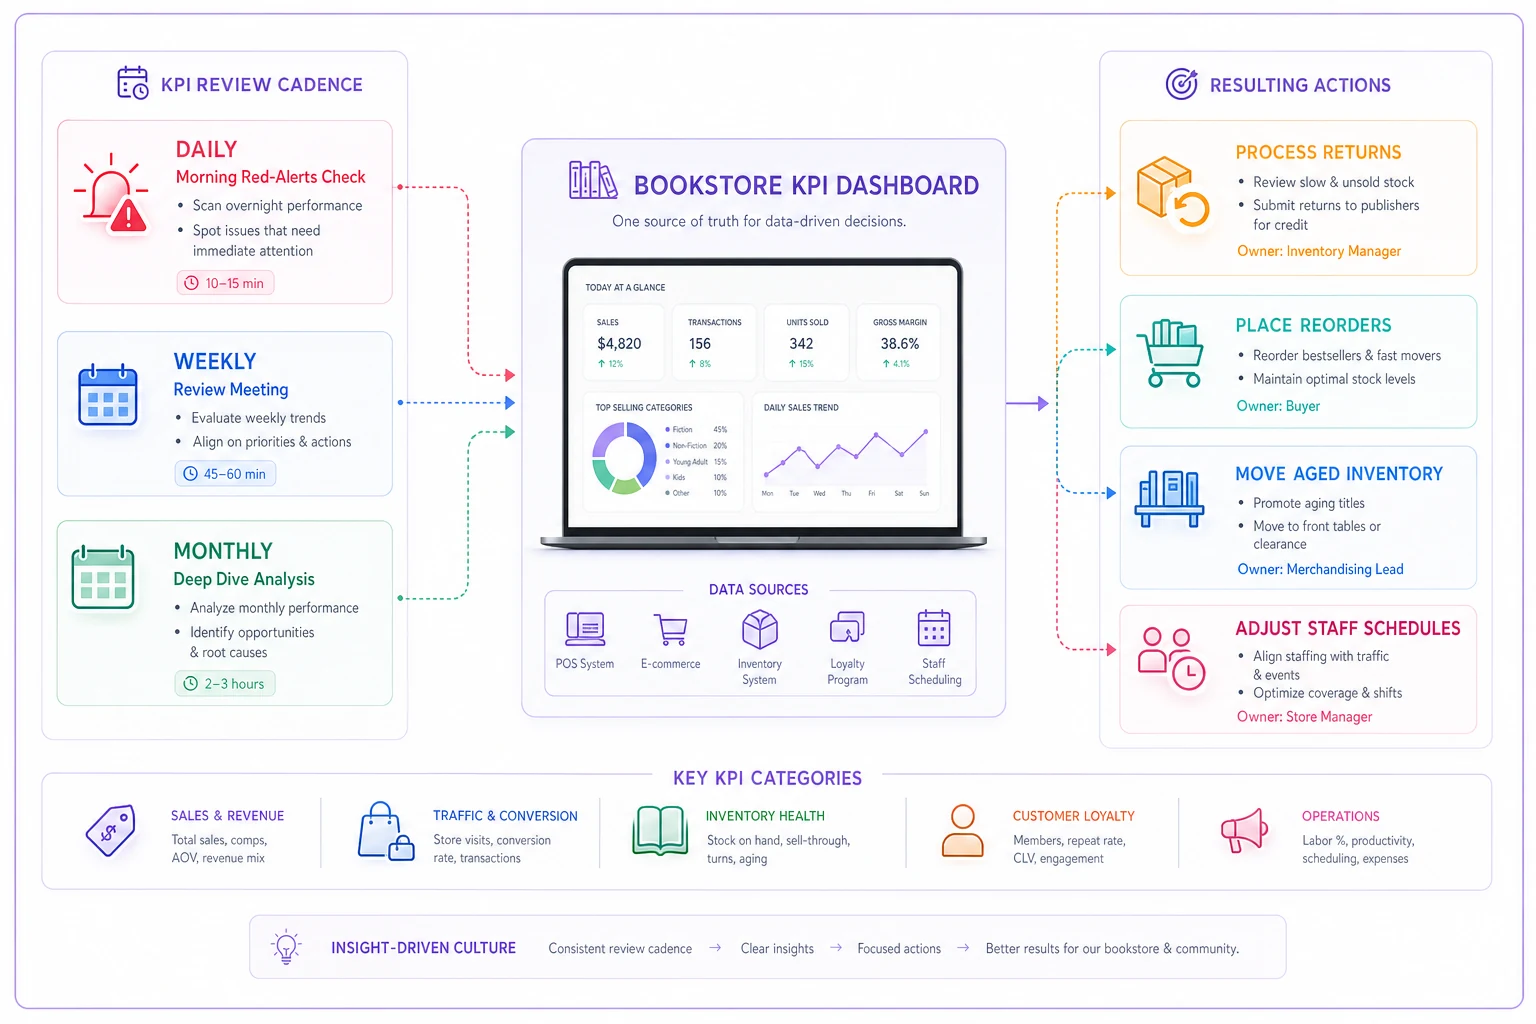
Automate the morning red-alerts email so the daily 5-minute check becomes part of opening routine.
The weekly review needs a protected time slot. Monday morning before opening works for most stores, when you're planning the week anyway. Don't try to squeeze it between customers on a Saturday.
Real scenario: How Riverside Books fixed their dead inventory problem
Riverside Books in a college town was sitting on $47,000 in inventory, with roughly $280,000 in annual sales. Pretty typical for a 2,000 square foot indie bookstore. The owner, Margaret, knew she had dead inventory but didn't know how much or where.
The first dashboard report was brutal. 34% of inventory hadn't sold a single copy in 90 days. Another 18% had been sitting for 60-89 days. Over half her working capital was tied up in books that weren't moving.
The dashboard got interesting here. The problems weren't evenly distributed:
-
Political books
67% aged over 90 days
-
Poetry
43% aged over 90 days
-
Fiction
only 18% aged over 90 days
-
Kids books
12% aged over 90 days
Margaret had been treating all sections the same, but the data showed clear patterns. Political books age fast after their news cycle. Poetry sells slowly but steadily – those "aged" books were actually selling one copy every 100 days, acceptable for the category. Fiction and kids books were turning nicely.
The dashboard also revealed timing patterns. August returns were worth 40% more publisher credit than October returns because of how publisher fiscal years work. Special orders not picked up within 30 days had an 85% abandonment rate.
After three months using decision triggers:
-
Inventory dropped to $38,000
-
Sales stayed flat at roughly $280,000
-
Cash flow improved by $9,000 just from not carrying dead weight
-
Return rate dropped from 18% to 11%
The biggest change wasn't the numbers though. Margaret stopped doing panicked discount sales every month. She knew exactly which books to return, when to return them, and what discount percentage actually moved different categories.
Why manual tracking breaks at scale
Small bookstores often start with spreadsheets. Track your top 50 titles, maybe organize by category, update weekly. This works fine when you're doing $150K annually and know every book on your shelves.
But spreadsheet systems have an operational ceiling. Around $300K in revenue, or roughly 10,000 SKUs, the manual work overwhelms the benefit. You spend more time updating spreadsheets than making decisions. Data goes stale. Important patterns get missed because nobody has time to cross-reference multiple reports.
The breaking point usually comes during the holiday rush. October through December can be 40% of annual revenue for bookstores. Suddenly your careful manual tracking can't keep up with velocity. You're ordering blind, discounting randomly, and missing return windows because there's no time to review everything.
This is where operational software starts making sense. Not because manual systems don't work, but because they don't scale. When you're processing 50 transactions daily, hand-tracking inventory is possible. At 150 transactions, it becomes a full-time job that nobody has time for.
Modern bookstore operations platforms pull data directly from your POS, apply your decision rules automatically, and surface just the decisions that need human judgment. Instead of spending hours building reports, you spend minutes acting on recommendations.
The AI automation component handles pattern recognition that humans miss when overwhelmed. It spots that mystery novels sell better on rainy weekends, that cookbook sales spike three weeks before major holidays, that certain authors have loyal followers who buy everything immediately. These patterns exist in your data, but finding them manually requires analysis time that doesn't exist in daily operations.
Making the dashboard work with your existing systems
Most independent bookstores run on one of four POS systems, and they all have quirks that affect dashboard building. If you're on IndieCommerce, Booklog, Basil, or even still running Bookmaster, you can build functional KPI tracking.
The trick is working with the data you actually have, not the data you wish you had. Most POS systems won't track customer lifetime value or browsing patterns. But they all track the fundamentals: what sold, when it sold, what's currently in stock, and how long it's been there.
Start with daily sales exports. Every system can do this, even if it's clunky. Pull the raw data into whatever dashboard tool you're comfortable with. Google Sheets works fine for stores under $500K annually. Beyond that, you need something more robust or you'll spend all day waiting for calculations.
Categories need mapping. Your POS might have 200 categories but you make decisions on maybe 15. Fiction, Mystery, Romance, Kids, Cooking, Biography – the sections customers actually shop. Map everything into decision-making buckets, not library classification systems.
Connect your return windows to publisher terms. This is manual setup but saves thousands annually. Each publisher has different terms – some give you 90 days, others a full year. Your dashboard needs these rules encoded so you never miss a window again.
For stores ready to eliminate manual data pulling entirely, AI-powered operational platforms can integrate directly with your POS. They automatically pull sales data, apply your specific business rules, and generate recommendations without the spreadsheet maintenance. But even without full automation, a basic dashboard beats flying blind.
The bottom line on bookstore metrics
Running an independent bookstore profitably isn't about loving books. It's about operational discipline that keeps inventory fresh, margins healthy, and cash flow positive. The stores thriving today aren't necessarily the ones with the best curation or the coziest reading nooks. They're the ones that know their numbers and act on them consistently.
Your KPI dashboard doesn't need complexity. Five core metrics, clear decision triggers, and a simple daily routine beat elaborate systems nobody actually uses. Start with inventory aging and work from there. Add complexity only when the simple system runs smoothly.
The biggest shift is moving from reactive to proactive inventory management. Instead of discovering dead inventory during annual counts, you're catching it at 60 days. Instead of guessing what to reorder, you know exactly when steady sellers need restocking. Instead of blanket discounts hoping something sticks, you test and measure what drives velocity in each category.
The bookstores that survive the next decade won't be the ones that resist operational modernization. They'll be the ones that combine their community connection and curation expertise with the operational discipline that healthy businesses require. A good dashboard makes that discipline systematic rather than
Ready to elevate your bookstore’s operations?
Join 500+ bookstores using Bookstorely to boost sales, optimize stock, and delight book lovers.